Figures & data
Figure 1. Schematic overview of the design of the study. A tumescent liposuction solution containing adrenaline, lidocaine, sodium bicarbonate, and normal saline was injected to subcutaneous adipose tissue. The main cell components of adipose tissue comprise stromal vascular fraction (SVF) cells, mature adipocytes (MAs), and blood circulation cells. Adipose tissue produces a large amount of extracellular vesicles (EVs) (referred to as EVs derived from lipoaspirate fluid (LF-EVs)) during the liposuction process. These LF-EVs were aspirated with the adipose tissue and tissue fluid into sterile containers. The LF-EVs were purified using sequential centrifugation and characterized by transmission electron microscopy (TEM), nanoparticle tracking analysis (NTA), and western blotting. The global profiles of proteins and miRNAs from LF-EVs were identified. The biological functions of LF-EVs in vitro and in LF-EVs-assisted lipotransfer in vivo were studied
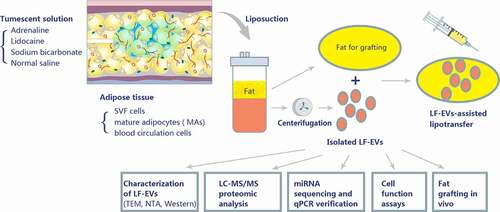
Table 1. Top 20 miRNAs and their microRNA-specific primer sequences and relative expression quantification
Table 2. Day-wise schedule of LF-EVs-assisted fat transplantation
Table 3. Primers for the real-time polymerase chain reaction of the fat grafts
Figure 2. Characterization of LF-EVs. (a) The semitransparent gelatinous appearance of the obtained pellet (LF-EVs) after ultracentrifugation. (b) Transmission electron micrograph of the LF-EVs revealed cup-shaped structures with different sizes. Scale bar = 200 nm. (c) The size distribution and concentration of LF-EVs as determined by nanoparticle tracking analysis (NTA). (d) Identification of LF-EVs by the detection of TSG101, CD9, and GAPDH with 20 μg of proteins loaded per lane. Compared with ADSCs, CD9 is highly abundant in LF-EVs, with only a small amount of GAPDH; while GAPDH and TSG101 are highly abundant in ADSCs, with little CD9. LF-EVs, extracellular vesicles derived from lipoaspirate fluid; ADSCs, adipose tissue-derived stem cells
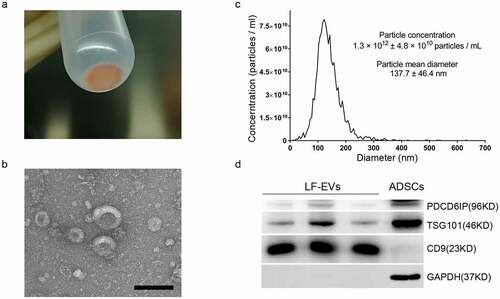
Figure 3. Bioinformatic analysis of proteins enriched in LF-EVs. (a) Venn diagram illustrating that of the 95.81% gene symbols in LF-EVs overlapped with entries in the Vesiclepedia database. b-d. GO analysis to group the identified proteins. For each GO term (‘Cellular compartment’ (b), ‘Molecular function’ (c), ‘Biological process’ (d)), six categories with the highest statistical significance of protein enrichment within the given category (calculated as −log10(p-value)) are presented on the graphs.(e) KEGG pathway enrichment bar plot. Different colours correspond to different main classes. The y-axis shows the KEGG_Subclasses. The data corresponding to the x-axis indicates the percentage of genes with this role in the pathway among the total identified genes; and the number of each line represents the number of identified genes enriched for each KEGG_Subclass. LF-EVs, extracellular vesicles derived from lipoaspirate fluid; GO, gene ontology; KEGG, Kyoto encyclopaedia of Genes and Genomes
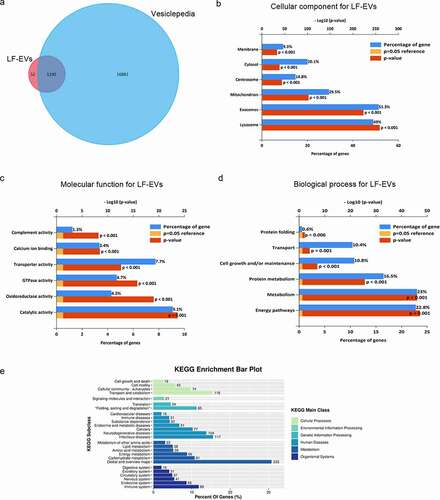
Table 4. Comparison results between identified proteins with gene symbols of normal cell markers in adipose tissue and blood in CellMarker database
Figure 4. Enriched ontology clusters for target genes of the top 13 miRNAs (the same as those top 13 target microRNAs names listed in ) enriched in LF-EVs. (a) Bar graph of the top 20 enriched terms in the Metascape Gene List Analysis Report, one row per cluster, coloured by p-values. (b) Enriched main GO Biological Processes terms related to fat grafting. LF-EVs, extracellular vesicles derived from lipoaspirate fluid; GO, gene ontology
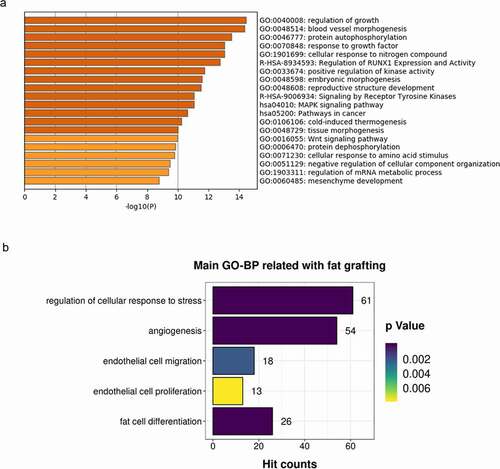
Figure 5. LF-EVs promoted the proliferation and migration of endothelial cells. (a) Representative fluorescence photomicrograph showing the internalization of DiR-labelled-LF-EVs (red) by HUVECs. Scale bar = 25 μm. (b) The proliferation of HUVECs measured using the CCK8 method; the optical density (OD) values from three individual experiments on day 1, 2, 3, 4, and 5 are provided. (c) The images of cell scratch test in HUVECs incubated with LF-EVs (100 μg/mL) or 0.9% normal saline (N.S.) for 6, 12, and 24 h. Bar = 200 μm. (d) The wound-healing percentage of HUVECs is presented as the migration area/original area. Note: (** P < 0.01). LF-EVs, extracellular vesicles derived from lipoaspirate fluid; DiR, DiIC18(7) (1,1ʹ-dioctadecytetramethyl indotricarbocyanine Iodide); HUVECs, human umbilical vein endothelial cells; CCK8, cell counting kit 8
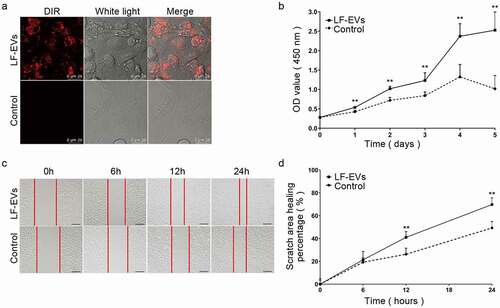
Figure 6. LF-EVs induced angiogenesis and adipogenesis in vitro. (a) Typical tube-like structures of HUVECs in matrigel in the two groups are shown. The formation of tubules could be observed after 2 hours and partially disintegrated after 8 hours. (b) The total number of tube structures per field of view from three experiments were analysed. (c) Representative fluorescence photomicrographs showing the internalization of DiR-labelled-LF-EVs (red) by the ADSCs. Scale bar = 25 μm. (d) Representative images of lipid droplets formed in human ADSCs induced with LF-EVs (100 μg/mL) or 0.9% normal saline (N.S.) are shown by staining with Oil Red O solution. Bar = 100 μm. (e) Semi-quantitative analysis of the relative Oil Red O absorbance per μg of protein in the two groups after adipogenic induction. Data in each bar chart represents the mean ± SD. Note: (* P < 0.05 and ** P < 0.01). LF-EVs, extracellular vesicles derived from lipoaspirate fluid; HUVECs, human umbilical vein endothelial cells; DiR, DiIC18(7) (1,1ʹ-dioctadecytetramethyl indotricarbocyanine Iodide); ADSCs, adipose tissue-derived stem cells
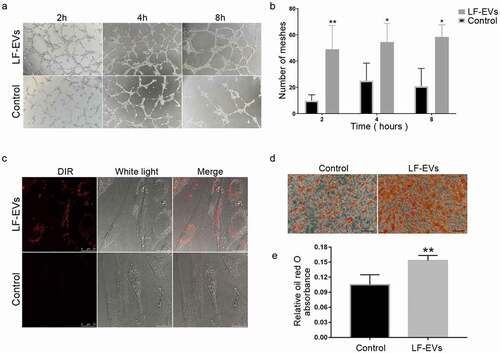
Figure 7. The uptake of DiR-labelled-LF-EVs in vivo. (a) Typical images of mice showing the uptake of DiR-labelled-LF-EVs in the fat tissue after local transplantation. (b) Total fluorescence intensity for DiR-labelled-LF-EVs was calculated in the region of the fat graft and results were expressed as total radiant efficiency [p/s/cm2/sr]/[μW/cm2]. (c) Representative fluorescence photomicrographs showing the internalization of DiR-labelled-LF-EVs (red) by the cells of the local fat graft (frozen section and nuclei were stained with DAPI) at the 14th day after transplantation. Scale bar = 25 μm. Note: (** P < 0.01). LF-EVs, extracellular vesicles derived from lipoaspirate fluid; DiR, DiIC18(7) (1,1ʹ-dioctadecytetramethyl indotricarbocyanine Iodide); DAPI, 4′,6-diamidino-2-phenylindole
![Figure 7. The uptake of DiR-labelled-LF-EVs in vivo. (a) Typical images of mice showing the uptake of DiR-labelled-LF-EVs in the fat tissue after local transplantation. (b) Total fluorescence intensity for DiR-labelled-LF-EVs was calculated in the region of the fat graft and results were expressed as total radiant efficiency [p/s/cm2/sr]/[μW/cm2]. (c) Representative fluorescence photomicrographs showing the internalization of DiR-labelled-LF-EVs (red) by the cells of the local fat graft (frozen section and nuclei were stained with DAPI) at the 14th day after transplantation. Scale bar = 25 μm. Note: (** P < 0.01). LF-EVs, extracellular vesicles derived from lipoaspirate fluid; DiR, DiIC18(7) (1,1ʹ-dioctadecytetramethyl indotricarbocyanine Iodide); DAPI, 4′,6-diamidino-2-phenylindole](/cms/asset/71aa70cc-6705-458c-a9ae-8d9992c4b57d/kadi_a_1932355_f0007_oc.jpg)
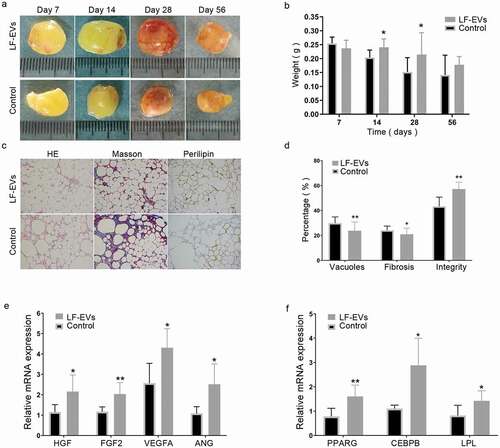
Figure 8. The effect of LF-EVs-assisted fat transplantation. (a) Gross appearance of fat grafts at different time points after the operation. Scale bar = 1 cm. (b) The weights of fat grafts at different time points. (c) Histological staining of the fat graft at 28 days after lipotransfer. Scale bar = 200 μm. (d) Histological analysis to evaluate the grafts at 28 days post-transplantation. The percentage areas of vacuoles, fibrosis, and cell structural integrity were calculated through HE, Masson, and perilipin-1 immunohistochemical staining, separately. (e) LF-EVs induced gene expression in transferred fat tissues at 14 days. Quantitative real-time PCR analysis of the mRNA expression of angiogenic factors (Hgf, Fgf2, Vegfa, Ang) and (f) adipogenic factors (Pparg, Lpl, Cepbp). Note: (* P < 0.05 and ** P < 0.01). LF-EVs, extracellular vesicles derived from lipoaspirate fluid; HE, haematoxylin and eosin