
Figures & data
Figure 1. Differentially expressed genes (DEGs) between the obesity and control cohorts. Volcano plot of GSE133099 and 11 substantially expressed genes were detected. Black, green, and red dots represent unchanged, downregulated, and upregulated genes, in that order
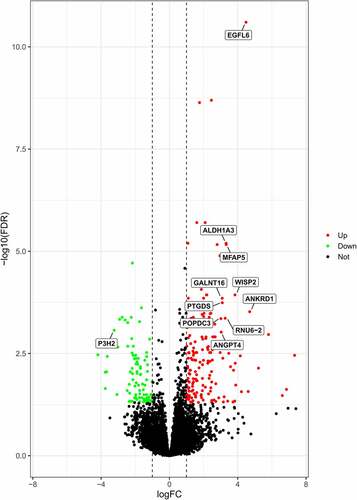
Table 1. Significantly enriched GO terms in obesity-related DEGs
Table 2. Significantly enriched pathways in obesity-related DEGs
Figure 2. Biological functions based on Gene Ontology (GO) analysis of obesity-related DEGs
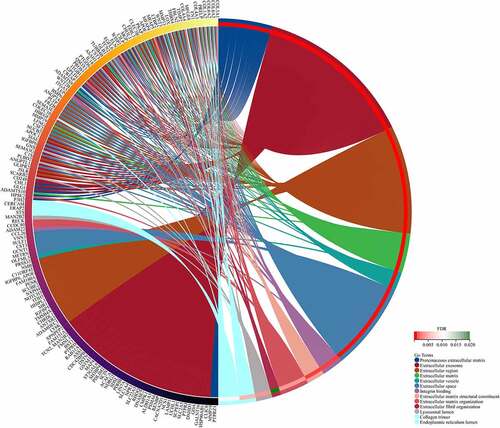
Figure 3. KEGG pathway analysis of obesity-related DEGs
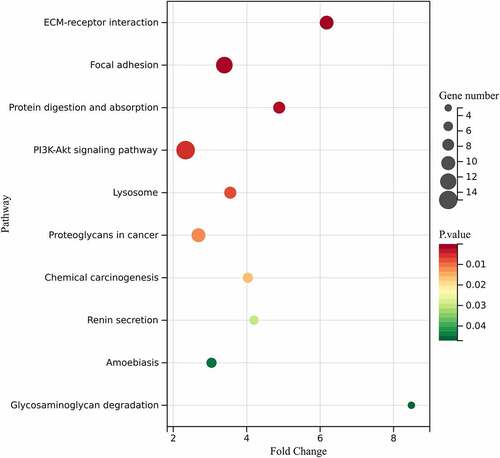
Table 3. Tissue-specific genes identified using BioGPS
Figure 4. Common hub genes based on Degree, Stress, and EcCentricity algorithm
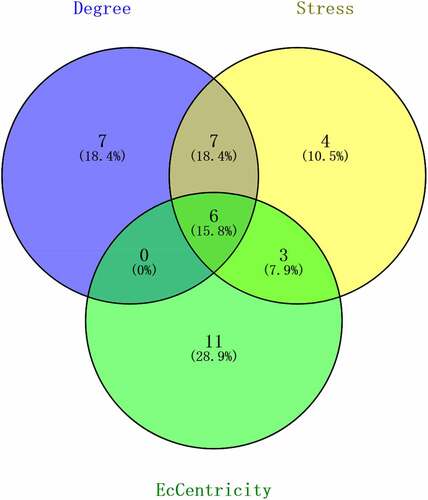
Figure 5. Venn diagram showing the key genes involved in obese adipocyte samples
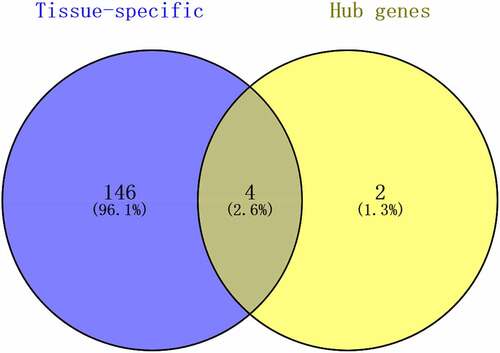
Table 4. Nine FDA-approved drugs potentially targeting the four key genes