
Figures & data
Table 1. Donor characteristics
Figure 1. Generation of WAT organoids. (a) Overview of experimental procedures. Culture medium and the appropriate time scale are indicated. (b) Microphotographs of organoids during adipogenic differentiation in agar-coated 6-well plates. Magnification: 50×; Scale bar: 100 µm. A representative result of n = 3 different donors is shown. (c) Organoid size during adipogenesis. The diameter of n = 6–10 individual organoids per donor were measured using microphotographs and the volume was calculated as described in the Methods section. The data were pooled and values are presented as mean ± SEM of n = 3 different donors. Statistical analysis was done using one-way ANOVA with Dunnett's Multiple Comparison Test. (d) Haematoxylin/Eosin (H/E) staining of formalin-fixed paraffin-embedded (FFPE) organoids during adipogenesis. Sections: 4 µm; Magnification: 100×; Scale bar: 100 µm; A representative result of n = 3 different donors is shown. (e) Immunohistochemistry of FFPE organoids using an antibody against the adipocyte marker FABP4 (green). Nuclei were stained with DAPI (blue). Images were taken with the Confocal Scanner System Cell Voyager CV1000 (Yokogawa). A representative result of n = 3 donors is shown. Magnification as indicated. Scale bar: 100 µm.
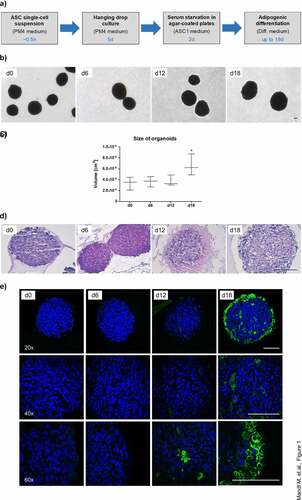
Figure 2. Intracellular triglyceride accumulation in organoids. Whole-mount staining of organoids employing the lipid-specific dyes LipidTOX™ and Bodipy™ on d 12 and d 18 of adipogenesis. Images were taken with the Confocal Scanner System Cell Voyager CV1000 (Yokogawa). A representative result of n = 3 different donors is shown. Magnification as indicated. Scale bar: 100 µm.
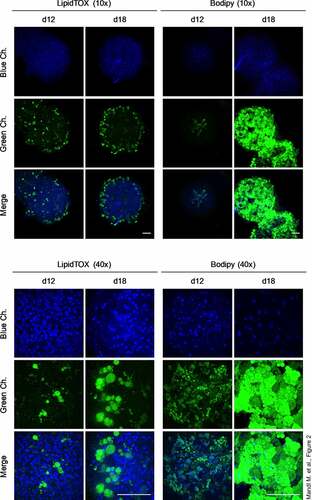
Figure 3. Analysis of adipogenic markers in the course of differentiation. (a) mRNA expression of adipogenic genes measured by RT-qPCR. A representative result of n = 3 different donors is shown. Values are presented as mean ±SEM of three technical replicates. Statistical analysis was done using one-way ANOVA with Dunnett's Multiple Comparison Test. (b) Western blot analysis of adipogenic markers corresponding to (a). Left panel: A representative result of n = 3 different donors is shown. β-Actin served as loading control. Right panel: Densitometric analysis. Values are presented as mean ± SEM of three measurements. Statistical analysis was done using one-way ANOVA with Dunnett's Multiple Comparison Test. (c) Adiponectin ELISA of cell culture supernatants corresponding to (a) and (b). n. d.: not determined.
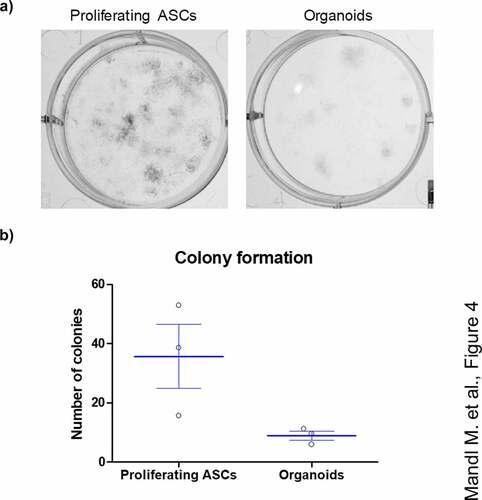
Figure 4. ASCs derived from adipose organoids retain the capability to form colonies. (a) Colony formation assays by ASCs derived from collagenase I-digested organoids and proliferating ASCs directly isolated from WAT of given donors are shown. Colonies are stained with crystal violet and counted. A representative result of n = 3 different donors, mean ± SEM, is shown. (b) Number of colonies formed by SVF-derived proliferating ASCs and digested organoids among n = 3 different donors. Three wells or organoids were used for each condition and donor.
Supplemental Material
Download Zip (13.3 MB)Data Availability Statement
The authors confirm that the data supporting the findings of this study are available within the article and its supplementary materials.