
Figures & data
Table 1. Detailed information on the included GEO datasets
Figure 1. Flow chart of the study design.
Figure 2. Visualization of DEGs in adipose tissue, liver tissue and skeletal muscle before and after BS. (a, c, e) Heatmap showing the expression of representative DEGs of each sample in adipose tissue (combination and normalization of GSE59034 and GSE66921), liver tissue (GSE106737) and skeletal muscle (combination and normalization of GSE134913 and GSE5109). The top 10 upregulated DEGs and top 10 downregulated DEGs ranked by logFC are shown as representative DEGs. In adipose tissue, only 4 upregulated DEGs were observed. (b, d, f,) DEGs in adipose tissue, liver tissue and skeletal muscle are presented in a volcano map. The representative DEGs were labelled with the gene names.
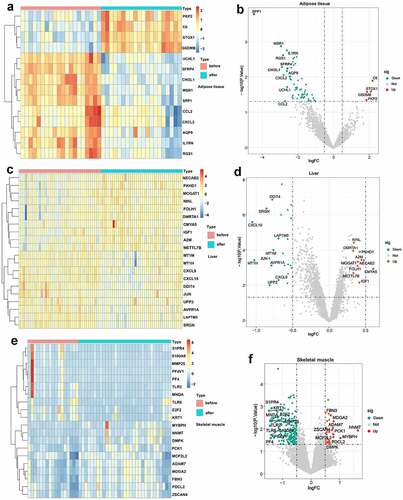
Figure 3. Venn diagram and enrichment analysis of DEGs from adipose tissue, liver tissue and skeletal muscle before and after BS.
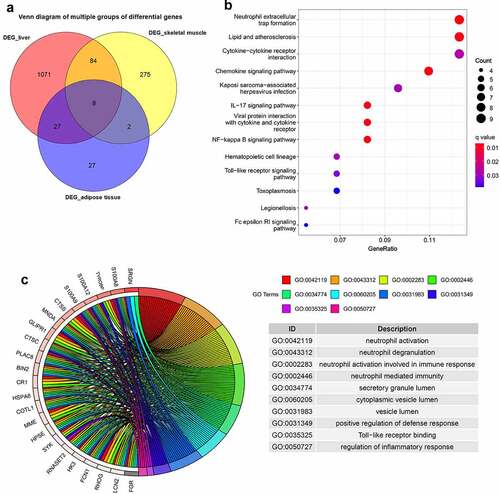
Figure 4. GSVA displaying pathway differences in adipose tissue, liver tissue and skeletal muscle before and after BS. GSVA was performed using the ‘GSVA’ R package to identify the pathway alterations in adipose tissue, liver tissue and skeletal muscle after BS. (a) Heatmap of GSVA in adipose tissue. (b) Heatmap of GSVA in liver tissue. (c) Heatmap of GSVA in skeletal muscle. Pathways with p< 0.05 were considered statistically significant.
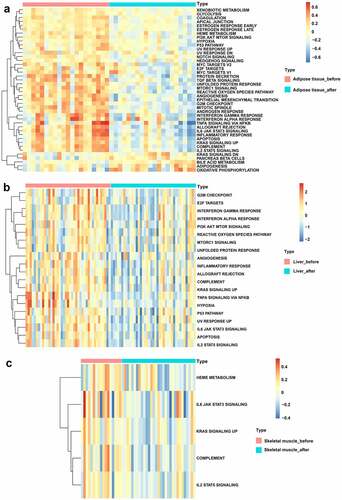
Figure 5. Identification of hub genes and prediction of TF, miRNA and drug-gene networks.(a) Construction of the PPI network of the 121 common DEGs. (b) Identification of hub genes by PPI network. (c) Construction of the hub gene-TF network. (d) Construction of hub genes-miRNA network. (e) Hub gene-drug interaction network.
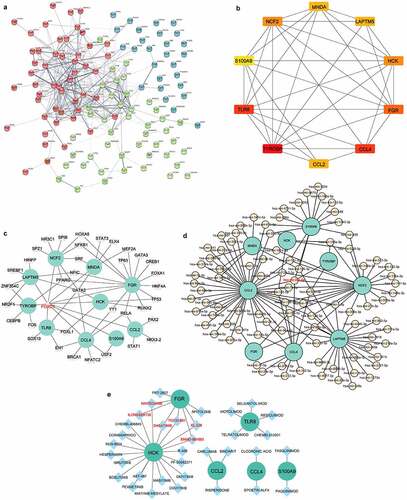
Figure 6. Analysis of immune cell infiltration in adipose tissue, liver tissue and skeletal muscle before and after BS according to the CIBERSORT algorithm. The differences in the relative percentages of infiltrating immune cells after BS were calculated by the CIBERSORT algorithm. The relative abundance of 22 different immune cells in (a) adipose tissue, (b) liver tissue and (c) skeletal muscle before and after BS. The Wilcoxon test was applied, and p< 0.05 was considered statistically significant.
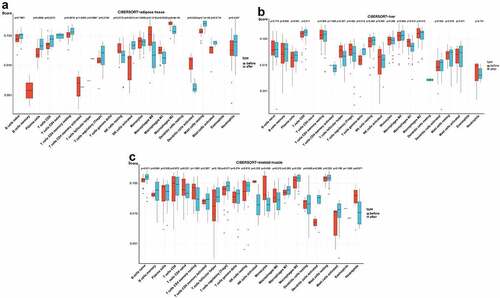
Figure 7. Association of hub genes and infiltrating immune cells in adipose tissue, liver tissue and skeletal muscle. Correlations of hub gene expression and infiltrating immune cells were analysed by Spearman correlation analysis. The heatmaps present correlations of hub gene expression and infiltrating immune cells in (a) adipose tissue, (b) liver tissue and (c) skeletal muscle. *p < 0.05.
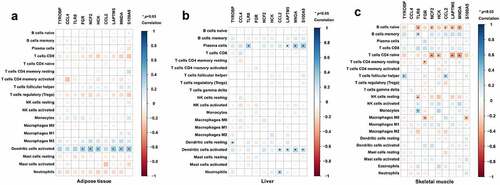
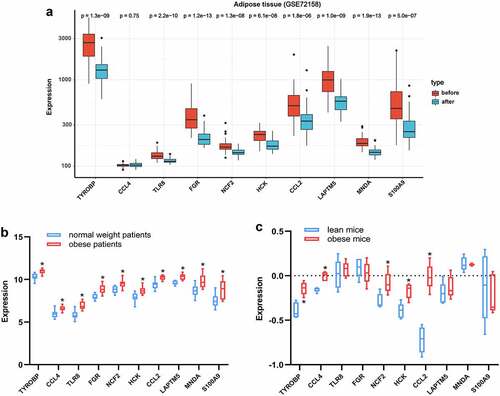
Figure 8. Validation of hub genes in adipose tissue. (a) Expression of hub genes in adipose tissue of obese subjects before (n = 42) and after BS (n = 42) was validated in the GSE72158 dataset. (b) Expression changes of hub genes in adipose tissue between obese (n = 10) and normal weight (n = 10) people were validated in the GSE151839 dataset. (c) Expression changes of hub genes in adipose tissue between obese (n = 5) and lean (n = 5) B6 mice were validated in the Attie Lab Diabetes database. The Wilcoxon test was performed. *p < 0.05.
Supplemental Material
Download Zip (1.9 MB)Data availability statement
The data that support the findings of this study are available in the GEO database (http://www.ncbi.nlm.nih.gov/geo) under reference numbers [GSE59034, GSE66921, GSE106737, GSE134913, GSE5109, GSE72158, and GSE151839].