
Figures & data
Figure 1. NR1D1 expression was decreased in adipocytes. a. Cell viability was detected by MTT. b. ELISA was used to detect TG. c. Detection of lipid droplets by oil red O staining. NR1D1. d. qRT-PCR detected NR1D1 expression. ** P < 0.01, *** P < 0.001.
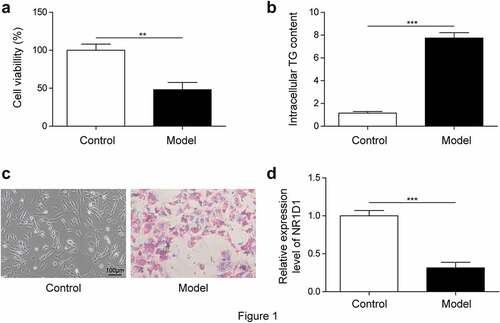
Figure 2. Overexpression of NR1D1 reduced lipid droplets. a-b. qRT-PCR measured NR1D1 expression. c. Cell viability was detected by MTT. d. ELISA was used to detect TG. e. Oil-red O staining detected lipid droplets. ** P < 0.01, *** P < 0.001.
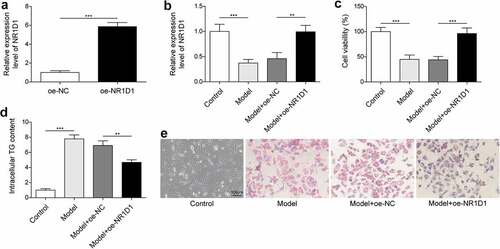
Figure 3. NR1D1 bound to the priming region of ULK1. a-b. qRT-PCR measured ULK1 expression. c. ChIP confirmed that NR1D1 could bind to ULK1. d. Dual-luciferase reporter assay verified the binding of NR1D1 to ULK1. ** P < 0.01, *** P < 0.001.
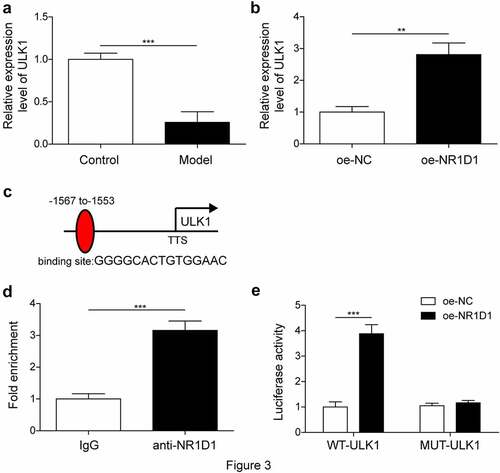
Figure 4. NR1D1 upregulated ULK1 to activate mitophagy and reduce lipid droplets. a-b. qRT-PCR measured ULK1 expression. c. MTT assay detected cell viability. d. Detection of mtROS. e. TG content was detected by ELISA. f. Detection of lipid droplets by oil red O staining. g. Western blot measured Parkin, PINK1 and TOM20 expression. H. Immunofluorescence staining for LC3.* P < 0.05, ** P < 0.01, *** P < 0.001.
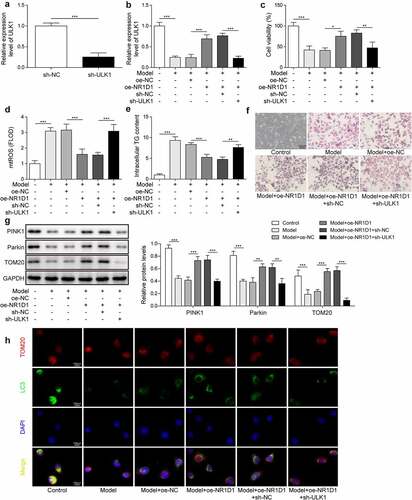
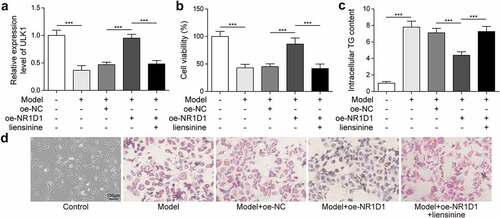
Figure 5. Upregulation of NR1D1 promoted mitophagy and reduced lipid droplets. a. qRT-PCR measured ULK1 expression. b. Cell viability was detected by MTT. c. ELISA was used to detect TG. d. Oil-red O staining detected lipid droplets. *** P < 0.001.
Data Availability Statement for Publicly Available Data Sharing Policy
All data generated or analyzed during this study are included in this article. The datasets used and/or analyzed during the current study are available from the corresponding author on reasonable request.