
Figures & data
Figure 1. Heatmap of 328 DEGs screened by limma package in R software. Red areas represent upregulated genes and green areas represent downregulated genes in the DIF and UNDIF group. DEG: differentially expressed gene; DIF: differentiated white adipocyte; UNDIF: undifferentiated preadipocytes.
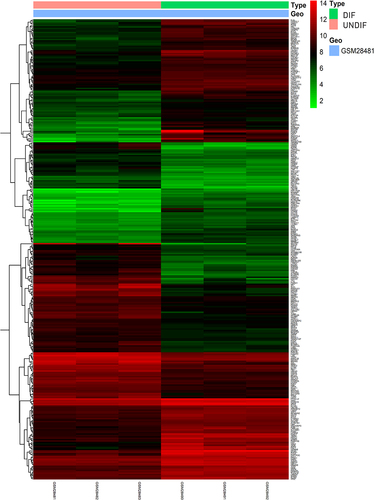
Figure 2. Volcano plot analysis identifies DEGs. Red dots represent 185 upregulated genes and green dots represent 143 downregulated genes from the DIF and UNDIF group.
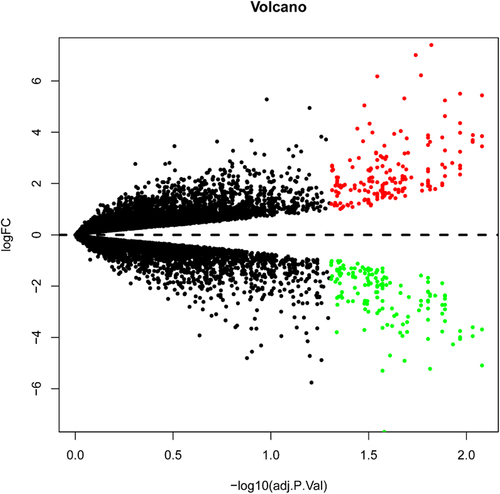
Table 1. Top 10 genes with the most neighbours and expanded nodes in Cytoscape
Figure 3. The PPI network of DGEs and the most significant modules of DEGs. (a) The PPI network was analysed by String software. There were 325 nodes and 655 edged in the PPI network. Red represents upregulated genes; green represents downregulated genes. (b) The most significant module identified by MCODE (score = 27.863) Dark blue represents the top 10 genes with the most neighbours and expanded nodes. DEG: differentially expressed gene; PPI: protein–protein interaction.
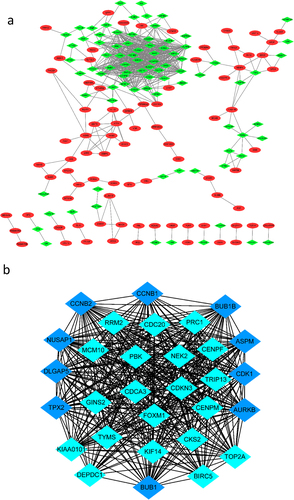
Figure 4. GO enrichment result of upregulated and downregulated DEGs respectively. Abscissa represents -LOG (pValue), and ordinate represents BP, CC, and MF terms. GO: Gene Ontology. BP: biological processes, CC: cellular components, MF molecular functions (MF).
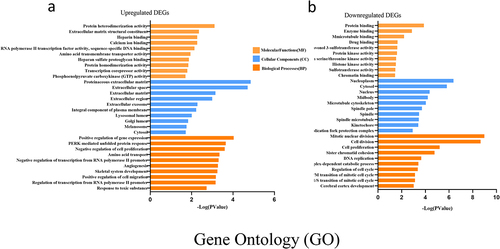
Figure 5. KEGG enrichment result of upregulated and downregulated DEGs respectively. DEGs. Abscissa represents -Log (pValue), and ordinate represents KEGG terms. KEGG: Kyoto Encyclopedia of Genes and Genomes.
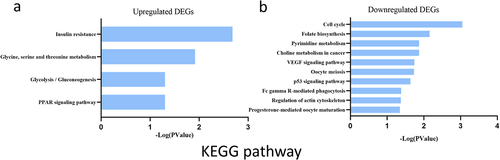
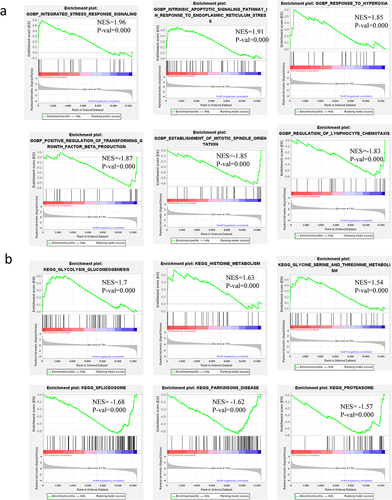
Table 2. Gene sets enrichment in GSEA analysis on GOBP and KEGG
Figure 6. Gene sets enrichment in GSEA analysis of all altered genes on GOBP, KEGG. a: BP of GO analysis of all altered genes in GSEA. b: KEGG analysis of all altered genes in GSEA.
Supplemental Material
Download Zip (527.1 KB)Data availability statement
The datasets generated for this study are available on request to the corresponding author.