
Figures & data
Table 1. Characteristics and fat cell sizes of total post-mortem cases and in female and male cases
Figure 1. Correlation matrix of information available from all post-mortem cases and fat cell sizes (FCS).
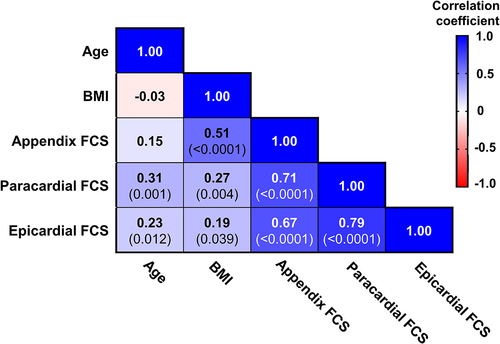
Figure 2. Univariable correlations of fat cell sizes with body mass index (BMI) and age from all post-mortem cases after sex separation.
Table 2. Stepwise linear regression for predictors of fat cell sizes in all cases and after sex separation
Figure 3. Univariable correlations of fat cell sizes with the related fat volume from the subset of post-mortem cases.
Table 3. Stepwise linear regression for predictors of fat cell sizes in subset of post-mortem cases with available fat volumes/area
Table 4. Stepwise linear regression analysis of fat cell sizes (FCS) as predictors of the size of fat cells in other depots in all cases