
Figures & data
Figure 1. Adipocytes incorporated exosomes derived from pancreatic cancer cells AsPC-1 and PANC-1.
(a) A representative electron microscopy image of AsPC-1 and PANC-1 exosomes. (b) The nanoparticle size distribution for AsPC-1 and PANC-1 exosomes detected by NTA. (c) PANC-1 secreted more exosomes as compared to AsPC-1. (d) Western blot analysis of exosome marker CD63 and TSG101. (E, F) Adipocytes were incubated with 200 μg/mL PKH26-labelled exosomes for the indicated times, and the uptake of exosomes was determined by fluorescence microscopy. E was the quantification of exosome internalization; F was the representative images (scale bar, 200 μm).
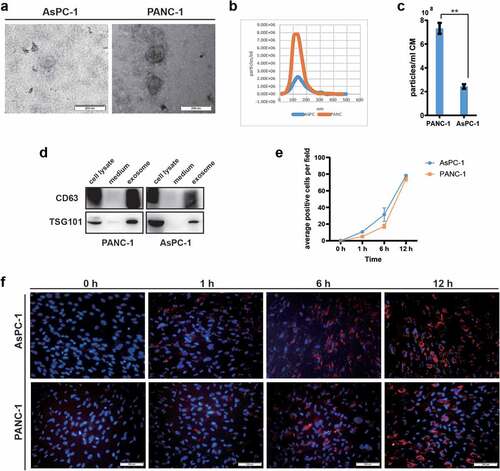
Figure 2. PANC-1 and AsPC-1 exosomes disrupted the lipid composition of adipocytes, particularly the TAG species.
(a) A Venn diagram showed the number of lipids significantly changed (fold change >2 or <0.5 in exosome-treated adipocytes vs control adipocytes) after exposure to PANC-1 or AsPC-1 exosomes. (b) The PCA scores plot of all samples; the left panel was calculated under ESI+ mode, the right panel was ESI-mode. (ESI is electrospray ionization, under ESI+ mode, molecules with positive ion signal could be detected, while under ESI-mode, molecules with negative ion signal could be detected). (c) The heat map representing the differential abundance of the top 20 selected lipids between exosome treatment groups and control groups (the left was ESI+ mode, the right panel was ESI-mode). (d) The relative percentage difference in concentration of all quantified lipid species between PANC-1 (left panel) or AsPC-1 exosomes (right panel) treated adipocytes and control adipocytes. Each dot represents a lipid species, and the dot size indicates significance. (e) Top 10 altered lipids in adipocytes following treatment with PANC-1 exosomes (left panel) and AsPC-1 exosomes (right panel).
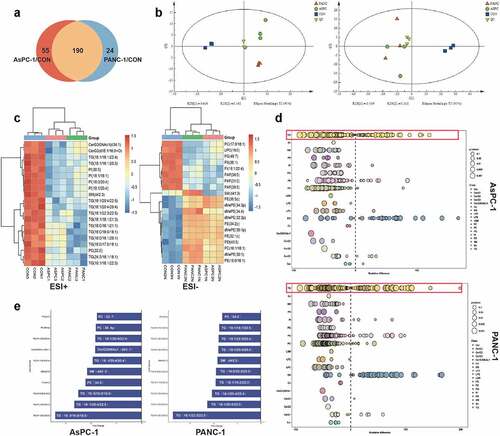
Figure 3. Pancreatic cancer exosomes stimulate lipolysis in adipocytes both in vitro and in vivo.
(a) glycerol release in adipocytes after treatment with PANC-1 or AsPC-1 exosomes for 24 h,48 h, and 72 h. (b) adipocytes were treated with 200 μg/ml PANC-1 or AsPC-1 exosomes for 24 h,48 h, and 72 h, then the LDs were stained with BODIPY 493/503 and visualized using a confocal microscope. Scale bar = 10 μm. (c) LD size was determined by measuring the diameter of at least 300 LDs using the ImageJ software. (d) Adipocytes were treated with different concentrations of PANC-1 and AsPC-1 exosomes for 72 h, then the LDs were stained with BODIPY 493/503 and visualized using a confocal microscope. Scale bar = 10 μm. (e) LD size was determined by measuring the diameter of at least 300 LDs using the ImageJ software. (f) H&E staining of abdominal and mesenteric adipose tissue in mice injected with PANC-1 or AsPC-1 exosomes. Scale bar, 200 μm, and for enlarged image, Scale bar, 50 μm.
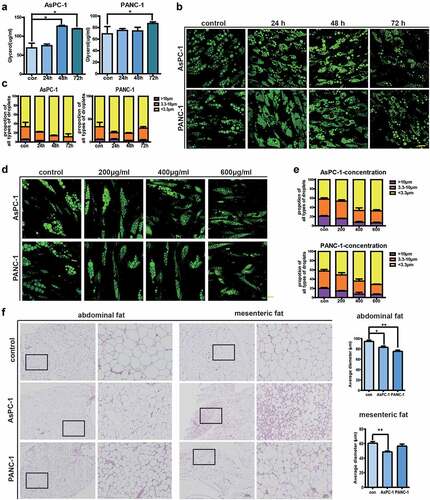
Figure 4. Transcriptomic analysis identifies expression changes of genes involved in metabolism and inflammation.
(a) A Venn diagram showed the number of genes that was up- or down-regulated by PANC-1 or AsPC-1 exosomes. (b) Heat map showed differentially expressed genes in PC exosome-treated adipocytes and control adipocytes. (c) GO analysis of genes that were up- or down-regulated by PANC-1 or AsPC-1 exosomes. (d) Unsupervised hierarchical clustering based on gene expression associated with lipid metabolism and inflammation.
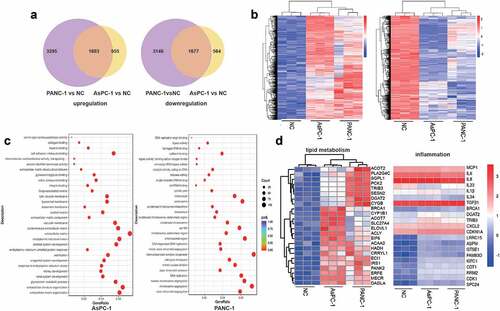
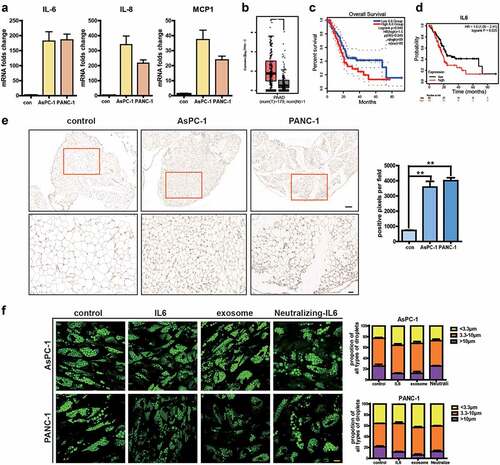
Figure 5. Pancreatic cancer exosomes increase IL-6 production which in turn promotes lipolysis in adipocytes.
(a) Expression levels of IL-6, MCP1, IL8 were detected by qRT-PCR. (b) The expression levels of IL-6 in PAAD as analysed by GEPIA2 database. * Indicated that P‐value is <0.01. (c, d) The prognostic potential of IL-6 in PAAD was evaluated by Kaplan‐Meier Plotter (c) and GEPIA2 (d). (e) Immunohistostaining analysis of IL-6 expression in adipose tissue of mice injected with AsPC-1 or PANC-1 exosomes. (f) LDs were stained with BODIPY 493/503 and visualized using a confocal microscope. Scale bar = 10 μm. LD size was determined by measuring the diameter of at least 300 LDs using the ImageJ software.
Supplemental material
Supplemental Material
Download Zip (1.1 MB)Data availability statement
The datasets used and/or analysed during the current study are available from the corresponding author on reasonable request.