Figures & data
Figure 1. Study protocol.
Table 1. Clinical and anthropometric patient data and summary of treatment outcomes.
Figure 2. Significant Pearson correlations between Δ adiponectin (ng/mL) and (a) Δ FT4, (b) Δ serum cholesterol, (c) Δ HDL-C, (d) Δ LDL-C following correction of hyperthyroidism. These markers thus serve as good predictors for serum adiponectin changes during the correction of hyperthyroidism in patients with Graves’ disease.
Figure 2. (continued).
Table 2. Significant differences in measured variables and adiponectin measurements between BAT-positive and BAT-negative patients.
Figure 3. Representative 18 F-FDG PET images illustrating tracer uptake and standardized uptake values (SUV) within the circumscribed regions of interest (ROI) correlating to supraclavicular brown adipose tissue (sBAT) depots. There is higher tracer uptake and SUV in a (a) BAT-positive hyperthyroid patient and a correspondingly lower uptake and SUV within the same ROI in a (b) BAT-negative hyperthyroid patient.
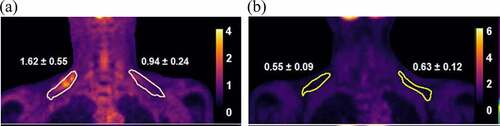
Table 3. Differences in treatment outcomes of BAT-positive and BAT-negative patients.
Figure 4. Differences in adiponectin levels in hyperthyroid and euthyroid states in both BAT-positive and BAT-negative groups.
Table 4. Loss of FT4 association with adiponectin in BAT-positive patients.
Figure 5. Changes in mean HOMA-IR scores between hyperthyroid and euthyroid states of the overall sample, BAT-positive and BAT-negative subjects.