Figures & data
Figure 1. MiR-425-3p levels in cancer cell-derived exosomes. (a) Expression levels of miR-425-3p in cancer or normal cells (n = 4). (b) Identification of exosomes by its markers. (c) Expression levels of miR-425-3p in NL20 or A549 cell-derived exosomes (n = 6). Data are presented as mean ± SD; **p < 0.01, ***p < 0.001 vs indicated group. N-Exo: normal (NL20) cell-derived exosomes; C-Exo: cancer (A549) cell-derived exosome.
Figure 2. Exosomal miR-425-3p inhibited preadipocyte proliferation and differentiation. HPA-v cells were incubated with 50 μg/L of exosomes or 50 nM of miR-425-3p mimics for 24 h (for cell proliferation) or 7 days (for adipogenic differentiation), respectively. Adipocyte differentiation was induced using a standard protocol. CytoD (2 μg/mL) was administrated to inhibit endocytosis. Oil red O staining and western blot were performed at day 7 of adipogenic differentiation. (a) Effect of exosomes on cell proliferation. (b) Effect of exosomes on oil red O staining. (c) Effect of exosomes on the protein levels of aP2 and ADPN. (d) Effect of exosomes with miR-425-3p inhibition on cell proliferation. (e) Effect of exosomes with miR-425-3p inhibition on oil red O staining. (f) Effect of exosomes with miR-425-3p inhibition on the protein levels of aP2 and ADPN. (g) Effect of miR-425-3p mimics on cell proliferation. (h) Effect of miR-425-3p mimics on oil red O staining. (i) Effect of miR-425-3p mimics on the protein levels of aP2 and ADPN. Data are presented as mean ± SD, n = 4; **p < 0.01, ***p < 0.001 vs indicated group. N-Exo: normal (NL20) cell-derived exosomes; C-Exo: cancer (A549) cell-derived exosomes; Mir-Inh-C-Exo: cancer (A549) cell-derived exosomes with miR-425-3p inhibition; CytoD: cytochalasin D; aP2: adipocyte protein 2; ADPN: adiponectin; CNTL: control.
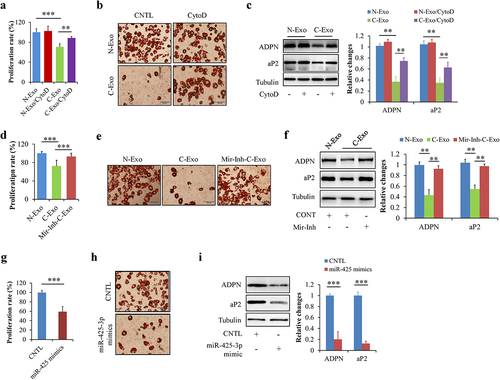
Figure 3. Exosomal miR-425-3p downregulated proliferation- and differentiation-related regulating genes. (a) The predicted miR-425-3p binding site in the 3ʹUTR of the related genes. (b-e) Luciferase reporter tests of miR-425-5p and the related genes. In order to observe the effect of exosomal miR-425-3p on protein levels, HPA-v cells were incubated with 50 μg/L of exosomes or 50 nM of miR-425-3p mimics for 24 h. CytoD (2 μg/mL) was administrated to inhibit endocytosis. (f) Effect of exosomes on the protein levels of C/EBPα, GATA2, IGFBP4, and MMP15. (g) Effect of miR-425-3p mimics on the protein levels of C/EBPα, GATA2, IGFBP4, and MMP15. Data are presented as mean ± SD, n = 4; *p < 0.05, **p < 0.01, ***p < 0.001 vs indicated group. N-Exo: normal (NL20) cell-derived exosomes; C-Exo: cancer (A549) cell-derived exosomes; CytoD: cytochalasin D; CNTL: control; WT: wild type; Mut: mutant.
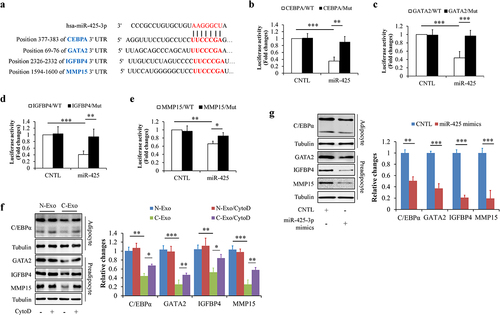
Figure 4. Exosomal miR-425-3p promoted adipocyte lipolysis and white adipocyte browning. Mature adipocytes were incubated with 50 μg/L of exosomes or 50 nM of miR-425-3p mimics for 24 h. CytoD (2 μg/mL) was administrated to inhibit endocytosis. (a) Effect of exosomes on oil red O staining. (b) Effect of exosomes on glycerol concentration in culture medium. (c) Effect of exosomes on UCP1 protein levels. (d) Effect of exosomes with miR-425-3p inhibition on oil red O staining. (e) Effect of exosomes with miR-425-3p inhibition on glycerol concentration in culture medium. (f) Effect of exosomes with miR-425-3p inhibition on UCP1 protein levels. (g) Effect of miR-425-3p mimics on oil red O staining. (h) Effect of miR-425-3p mimics on glycerol concentration in culture medium. (i) Effect of miR-425-3p mimics on UCP1 protein levels. Data are presented as mean ± SD, n = 4; **p < 0.01, ***p < 0.001 vs indicated group. N-Exo: normal (NL20) cell-derived exosomes; C-Exo: cancer (A549) cell-derived exosomes; Mir-Inh-C-Exo: cancer (A549) cell-derived exosomes with miR-425-3p inhibition; CytoD: cytochalasin D; CNTL: control.
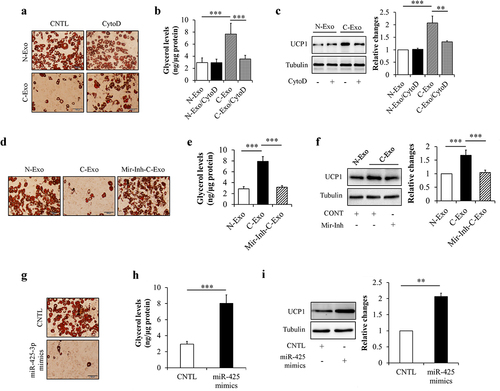
Figure 5. Exosomal miR-425-3p activated cAMP/PKA signalling and lipophagy. Mature adipocytes were incubated with 50 μg/L of exosomes or 50 nM of miR-425-3p mimics for 24 h. CytoD (2 μg/mL) was administrated to inhibit endocytosis. (a) Effect of exosomes on the intracellular cAMP concentration. (b) Effect of exosomes on the intracellular PKA activity. (c) Effect of exosomes on the protein or phosphorylated protein levels of CREB, HSL, and PLIN 1. (d) Effect of exosomes on the protein levels of beclin 1 and LC3. (e) Effect of miR-425-3p mimics on the intracellular cAMP concentration. (f) Effect of miR-425-3p mimics on the intracellular PKA activity. (g) Effect of miR-425-3p mimics on the protein or phosphorylated protein levels of CREB, HSL, and PLIN 1. (h) Effect of miR-425-3p mimics on the protein levels of beclin 1 and LC3. Data are presented as mean ± SD, n = 3; *p < 0.05, **p < 0.01, ***p < 0.001 vs indicated group. N-Exo: normal (NL20) cell-derived exosomes; C-Exo: cancer (A549) cell-derived exosomes; CytoD: cytochalasin D; CNTL: control.
Figure 6. MiR-425-3p targeted phosphodiesterase 4B (PDE4B). (a) The predicted miR-425-3p binding site in the 3ʹUTR of the PDE4B gene. (b) Luciferase reporter test of miR-425-3p and PDE4B. To observe the potential effect of exosomal miR-425-3p on PDE4B protein levels, mature adipocytes were incubated with 50 μg/L of exosomes or 50 nM of miR-425-3p mimics for 24 h. CytoD (2 μg/mL) was administrated to inhibit endocytosis. (c) Effect of exosomes on the PDE4B protein levels. (d) Effect of miR-425-3p mimics on PDE4B protein levels. Data are presented as mean ± SD, n = 3; **p < 0.01, ***p < 0.001 vs indicated group. N-Exo: normal (NL20) cell-derived exosomes; C-Exo: cancer (A549) cell-derived exosomes; CytoD: cytochalasin D; CNTL: control; WT: wild type; Mut: mutant.
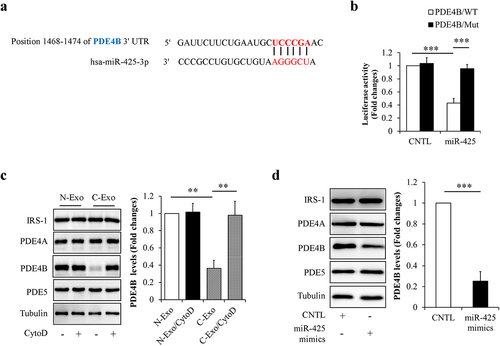
Figure 7. PDE4B depletion did not affect preadipocyte proliferation and differentiation, but promoted adipocyte lipolysis and white adipocyte browning. HPA-v cells were infected with lentiviruses carrying PDE4B shRAN to reduce PDE4B expression. Adipocyte differentiation was induced using a standard protocol. Oil red O staining and western blot were performed at day 7 of adipogenic differentiation. (a) Cell proliferation. (b) The protein levels of GATA2, IGFBP4, and MMP4 in PDE4B KD or control HPA-v cells. (c) Oil red O staining. (d) The protein levels of aP2 and ADPN in differentiated cells. To observe the potential effects of PDE4B on adipocyte lipolysis and white adipocyte browning, lentiviruses carrying PDE4B shRAN were used to knockdown PDE4B in mature adipocyte. (e) Oil red O staining. (f) Glycerol concentration in culture medium. (g) UCP1 protein levels. Data are presented as mean ± SD, n = 4; **p < 0.01, ***p < 0.001 vs indicated group. KD: knockdown; aP2: adipocyte protein 2; ADPN: adiponectin; CNTL: control, ns: no significant.
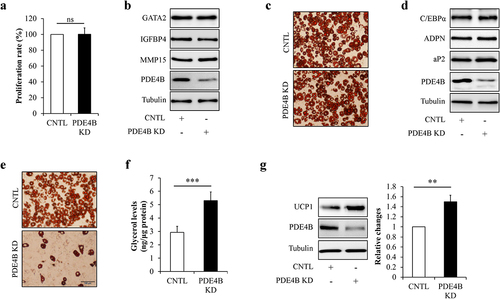
Figure 8. PDE4B depletion enhanced cAMP/PKA signalling and lipophagy. Mature adipocytes infected with lentiviruses carrying PDE4B shRAN or control were treated with or without 100 nM of autophagic inhibitor bafilomycin A1 (BFA) and/or 1 μM of PKA inhibitor PKI for 24 h. (a) Effect of PDE4B depletion on the intracellular cAMP concentration. (b) Effect of PDE4B depletion on the intracellular PKA activity. (c) Effect of PDE4B depletion on the protein or phosphorylated protein levels of CREB, HSL, and PLIN 1. (d) Effect of PDE4B depletion on the protein levels of beclin 1 and LC3. (e) Effects of BFA and PKI on cAMP/PKA signalling and lipophagy in PDE4B KD cells. (f) Effects of BFA and PKI on glycerol concentration in culture medium in PDE4B KD cells. (g) Effect of BFA on lipophagy and UCP1 protein levels in PDE4B KD cells. (h) Effect of PKI on UCP1 protein levels in PDE4B KD cells. Data are presented as mean ± SD, n = 3; *p < 0.05, **p < 0.01, ***p < 0.001 vs indicated group. KD: knockdown; CNTL: control; ns: no significant.
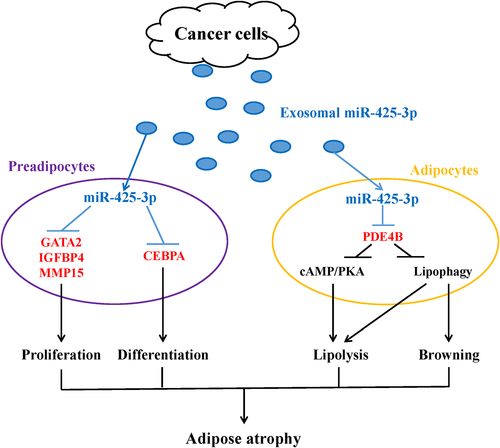
Figure 9. A schematic diagram for the impacts of cancer cell-derived exosomal miR-425-3p on adipocyte atrophy. Cancer cell-derived exosomal miR-425-3p targets proliferation- and differentiation-related regulating genes leading to the inhibition of preadipocyte proliferation and differentiation. In addition, PDE4B downregulation induced by cancer cell-derived exosomal miR-425-3p results in enhancement of adipocyte lipolysis and white adipocyte browning through activating cAMP/PKA signalling and/or lipophagy, respectively. The combined effects of these alterations will bring about adipocyte atrophy, ultimately leading to the loss of adipose tissue in cancer cachexia.