
Figures & data
Table 1. Description of BMI increase category by diagnosis and by gender.
Table 2. Genotype distributions by diagnosis.
Table 3. Genotype frequency for BMI change category by diagnosis.
Table 4. p-Value for .
Table 5. Allele frequency for BMI change category by diagnosis.
Figure 1. Significantly different Allele Frequencies for BMI change category by diagnosis for the CAV1 rs926198 and LEPR rs1137101 candidate genes.
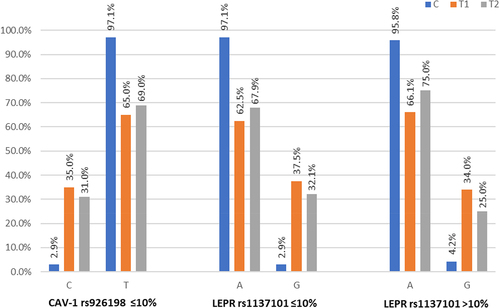
Table 6. Chi-squared and p values for .
Data availability statement
The participant data for this study is located in a data safe haven environment. The authors will provide a fully anonymized extract of the original data upon reasonable request.