
Figures & data
Figure 1. Preparation process of Coleman fat and ECM/SVF gels. ECM/SVF-gels are highly condensed in volume compared with Coleman fat. The final volume of the ECM/SVF gel was about one-quarter that of the Coleman fat.
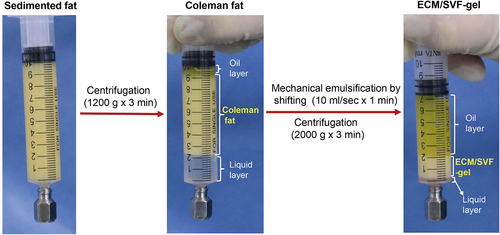
Figure 2. Volcano plot for DEGs, between Coleman fat and ECM/SVF-gels, revealing 9 upregulated and 73 downregulated DEGs in the ECM/SVF-gel. Each dot represents a detected gene; blue dots denote downregulated DEGs, and red dots represent upregulated DEGs. DEGs, differentially expressed genes.
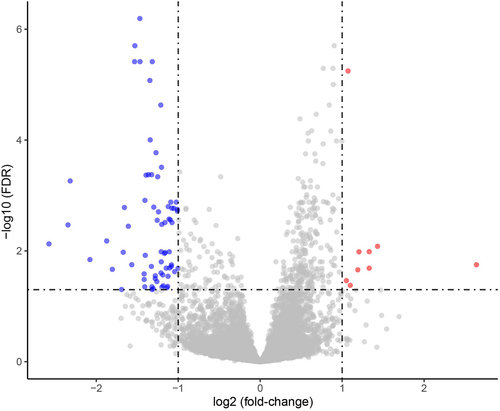
Figure 3. Gene Ontology (GO) functional enrichment analysis of 73 downregulated DEGs performed using the DAVID database (A) and Metascape platform (B), revealing enrichment of biological processes mainly associated with inflammatory response and immune response. DEGs, differentially expressed genes.
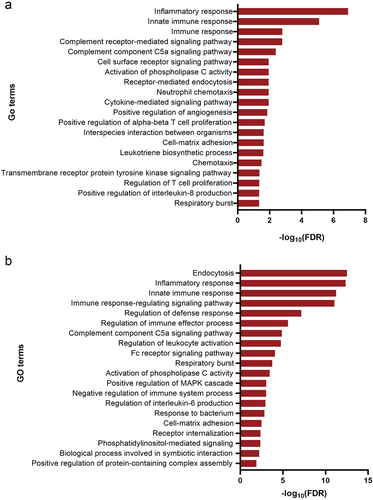
Figure 4. Web-based cell-type-specific enrichment analysis (WebCSEA) of 73 downregulated DEGs, revealing vasculature macrophages, muscle macrophages, and fat macrophages as the top 3 significantly enriched tissue-cell types. The X-axis represents 11 human organ systems. Y-axis indicates the – log10 (raw p-value) for each tissue-cell type from WebCSEA result. Each dot represents one tissue-cell type in the group on the X-axis differentiated by colour. The most significant dots are highlighted and annotated with their corresponding tissue-cell types. The red dashed line indicates the Bonferroni-corrected significance (p = 3.69 × 10−5) by 1355 tissue-cell types. The grey solid line indicates the nominal significance (p = 1 × 10⁻³). DEGs, differentially expressed genes.
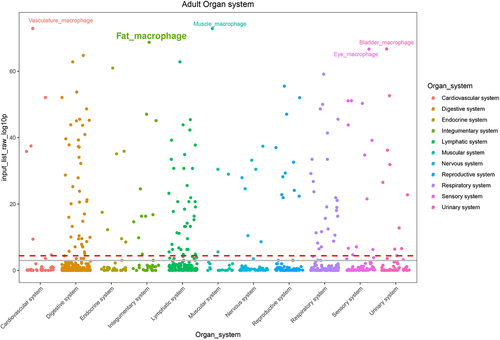
Figure 5. Gene set enrichment analysis (GSEA) based on whole gene expression profiles. (A and B) Gene sets involved in responses to interferon (IFN)-α and IFN-γ were enriched in the ECM/SVF-gel (FDR <0.05). (C and D) Gene sets involved in inflammatory response and adipogenesis were the top 2 gene sets enriched in Coleman fat (FDR <0.05). NES, normalized enrichment score.
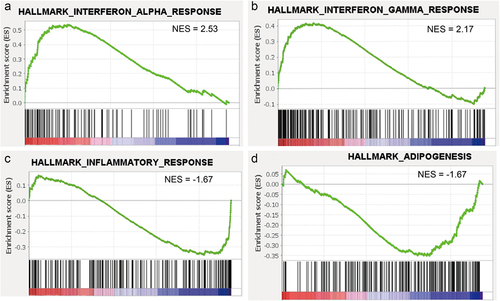
Figure 6. Composition of 22 immune cells in Coleman fat and the ECM/SVF-gel estimated by the CIBERSORT algorithm (only naïve CD4+ T cells were not detected in any of the samples). A. Relative proportion of 22 immune cells in each sample; B. Overall distribution of 22 immune cells in Coleman fat and the ECM/SVF-gel, indicating that M2 macrophages (28.8% vs. 23.2%), resting CD4+ memory T cells (17.9% vs. 21.5%), M1 macrophages (7.3% vs. 9.8%), resting mast cells (13.8% vs. 9.4%), and M0 macrophages (6.6% vs. 8.8%) represented the top five infiltrating cell types both in Coleman fat and the ECM/SVF-gel. In particular, M2 macrophages were the most prevalent. Each bar plot shows the cell type and relative percentage. Different colours represent different cell types, which are shown in the right side.
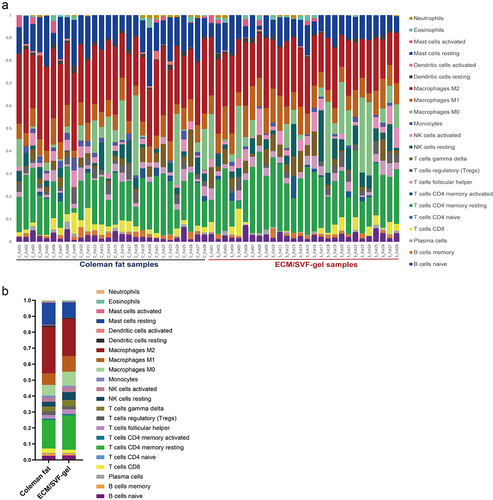
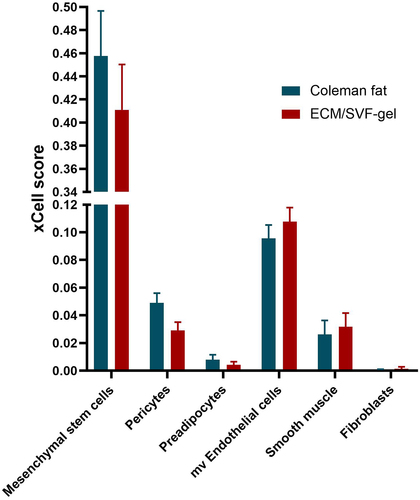
Figure 7. The xCell-inferred enrichment scores (xCell scores) of non-immune cell types in Coleman fat (blue) and the ECM/SVF-gel (red), indicating no statistical differences in xCell scores between the two groups. The xCell scores predict relative enrichment for cell types, resembling the fractions of the cell types, but not the exact cellular proportions. The error bar denotes standard error for the sample mean. Mesenchymal stem cells detected by xCell in adipose tissue actually were ADSCs. mv Endothelial cells, microvascular Endothelial cells.
Supplemental Material
Download Zip (15.3 MB)Data availability statement
The detailed information of our raw data link: The raw sequence data reported in this manuscript have been deposited in the Genome Sequence Archive (Genomics, Proteomics & Bioinformatics 2021) in National Genomics Data Center (Nucleic Acids Res 2022), China National Center for Bioinformation/Beijing Institute of Genomics, Chinese Academy of Sciences (GSA-Human: HRA007009) that are publicly accessible at https://ngdc.cncb.ac.cn/gsa-human.