1,585
Views
3
CrossRef citations to date
0
Altmetric
Review

STAT5a/b contribute to sex bias in vascular disease: A neuroendocrine perspective

, , &
Pages 1-20 | Received 13 Aug 2015, Accepted 27 Aug 2015, Published online: 21 Dec 2015

Figures & data

FIGURE 1. Mean plasma GH levels in female and male rats, 45 and 90 days old, sampled at 30-min intervals for a 6-h period. The number of animals in each group is shown in parenthesis. Vertical lines represent the SEM. Adapted from Edén (1979) with permission of The Endocrine Society.Citation60
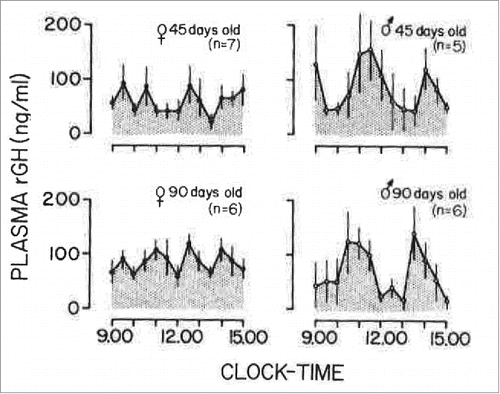
FIGURE 1. Mean plasma GH levels in female and male rats, 45 and 90 days old, sampled at 30-min intervals for a 6-h period. The number of animals in each group is shown in parenthesis. Vertical lines represent the SEM. Adapted from Edén (1979) with permission of The Endocrine Society.Citation60

FIGURE 2. Sex-bias in circulating GH levels in male and female humans. Panels A and B: representative profiles of plasma GH levels showing that both men and women have pulsatile GH levels, but there is a higher overall level of GH in women. Adapted from Winer et al (1990) with permission of The Endocrine Society.Citation61
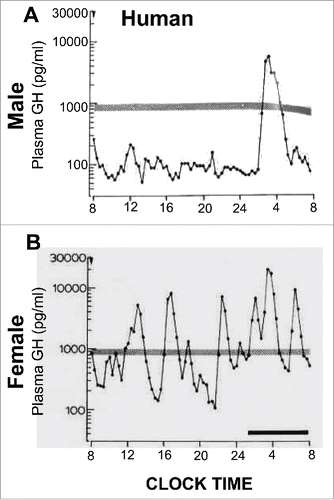
FIGURE 2. Sex-bias in circulating GH levels in male and female humans. Panels A and B: representative profiles of plasma GH levels showing that both men and women have pulsatile GH levels, but there is a higher overall level of GH in women. Adapted from Winer et al (1990) with permission of The Endocrine Society.Citation61

FIGURE 3. Schematics illustrating concepts of how male (pulsatile) vs female (more continuous) patterns of circulating GH elicit patterned activation of PY-STAT5 in the rat liver (Panel A), and thus sex-biased gene expression (Panel B). Schematics adapted from Waxman and O'Connor (2006) with permission of The Endocrine Society.Citation67
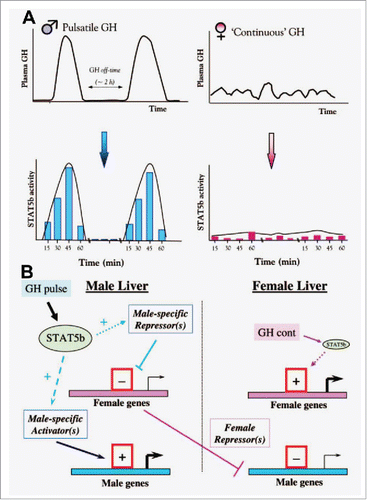
FIGURE 3. Schematics illustrating concepts of how male (pulsatile) vs female (more continuous) patterns of circulating GH elicit patterned activation of PY-STAT5 in the rat liver (Panel A), and thus sex-biased gene expression (Panel B). Schematics adapted from Waxman and O'Connor (2006) with permission of The Endocrine Society.Citation67

FIGURE 4. Sex-biased activation of PY-STAT5a/b in pulmonary arterial walls in wild-type mice after 7 weeks of chronic hypoxia (expt. as in ). At the conclusion of the experiment in , quantitative immunofluorescence was used to evaluate levels of PY-STAT5a/b in the arterial walls of pulmonary arterial segments in sections of lungs using methods previously described (83). *P <0.05 in comparisons between hypoxia and normoxia groups of the 2 sexes; and also in the male vs female hypoxia comparison; scale bar = 50 µm.
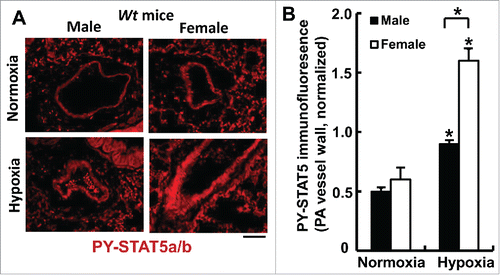
FIGURE 4. Sex-biased activation of PY-STAT5a/b in pulmonary arterial walls in wild-type mice after 7 weeks of chronic hypoxia (expt. as in Fig. 6). At the conclusion of the experiment in Fig. 6, quantitative immunofluorescence was used to evaluate levels of PY-STAT5a/b in the arterial walls of pulmonary arterial segments in sections of lungs using methods previously described (83). *P <0.05 in comparisons between hypoxia and normoxia groups of the 2 sexes; and also in the male vs female hypoxia comparison; scale bar = 50 µm.

FIGURE 5. Abrogation of the male dominance of PH in the chronic hypoxia model in mice with heterozygous SM22-Cre, STAT5a/b+/− deletion (7 weeks' of hypoxia; n= 5 per group). Panel A, RVSP; Panel B, RVH; Panels C, PA remodeling in terms of wall thickness; Panel D: PA remodeling in terms of SMA-positive vessels; Panel E, Van Gieson's elastin staining. Scale bar = 45 µm). *P <0.05. Adapted from Sehgal et al (2014).Citation83
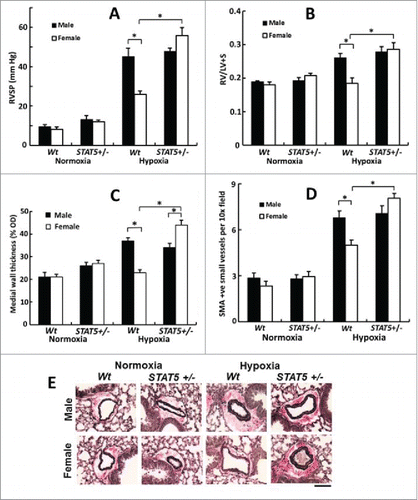
FIGURE 5. Abrogation of the male dominance of PH in the chronic hypoxia model in mice with heterozygous SM22-Cre, STAT5a/b+/− deletion (7 weeks' of hypoxia; n= 5 per group). Panel A, RVSP; Panel B, RVH; Panels C, PA remodeling in terms of wall thickness; Panel D: PA remodeling in terms of SMA-positive vessels; Panel E, Van Gieson's elastin staining. Scale bar = 45 µm). *P <0.05. Adapted from Sehgal et al (2014).Citation83
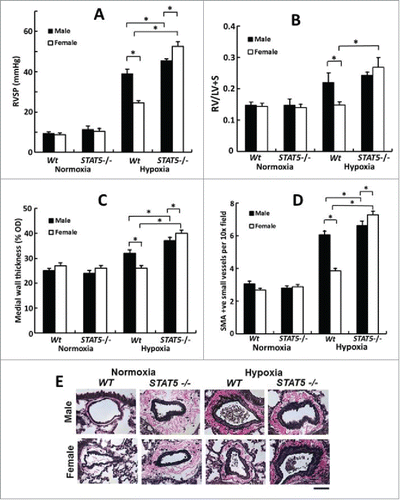
FIGURE 6. Female mice develop the severest PH in response to chronic hypoxia after homozygous SM22-Cre, STAT5a/b−/− deletion (7 weeks' of hypoxia; n= 5 per group). Panel A, RVSP; Panel B, RVH; Panels C, PA remodeling in terms of wall thickness; Panel D: PA remodeling in terms of SMA-positive vessels; Panel E, Van Gieson's elastin staining. Scale bar = 45 µm). *P <0.05. Adapted from Sehgal et al (2014).Citation83

FIGURE 6. Female mice develop the severest PH in response to chronic hypoxia after homozygous SM22-Cre, STAT5a/b−/− deletion (7 weeks' of hypoxia; n= 5 per group). Panel A, RVSP; Panel B, RVH; Panels C, PA remodeling in terms of wall thickness; Panel D: PA remodeling in terms of SMA-positive vessels; Panel E, Van Gieson's elastin staining. Scale bar = 45 µm). *P <0.05. Adapted from Sehgal et al (2014).Citation83

FIGURE 7. Resistance arteries (second-order mesenteric arteries) are “stiffer” in mice with homozygous SM22-Cre, STAT5a/b−/− deletion. The phenotypes of isolated pressurized (80 mm Hg) resistance arteries derived from groups of male and female wt and mutant mice were evaluated in terms of the vasorelaxation response to acetylcholine (Ach) using methods as in ref.Citation112 and expressed as % change in peripheral diameter (% PD)(pooled data from n = 4 per group; mean ±SE). *P < 0.05 comparing respective wt and knockout groups (pooling both sexes) by ANOVA.
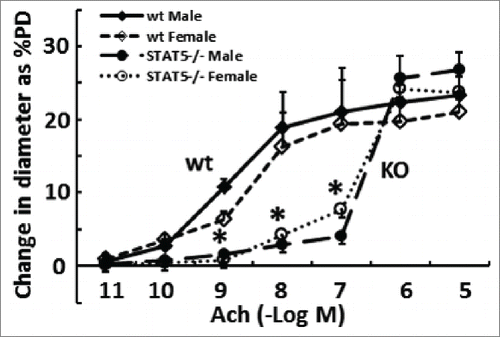
FIGURE 7. Resistance arteries (second-order mesenteric arteries) are “stiffer” in mice with homozygous SM22-Cre, STAT5a/b−/− deletion. The phenotypes of isolated pressurized (80 mm Hg) resistance arteries derived from groups of male and female wt and mutant mice were evaluated in terms of the vasorelaxation response to acetylcholine (Ach) using methods as in ref.Citation112 and expressed as % change in peripheral diameter (% PD)(pooled data from n = 4 per group; mean ±SE). *P < 0.05 comparing respective wt and knockout groups (pooling both sexes) by ANOVA.

FIGURE 8. Representative immunofluorescence images showing coordinate reductions in STAT5a/b, PY-STAT5 and BCL6 in obliterative pulmonary arterial lesions in male and female patients with late-stage IPAH compared to control arterial walls (white arrows). The patient numbers correspond to the listing in Supplemental Table 2 in ref. Citation83. Scale bar = 50 µm.
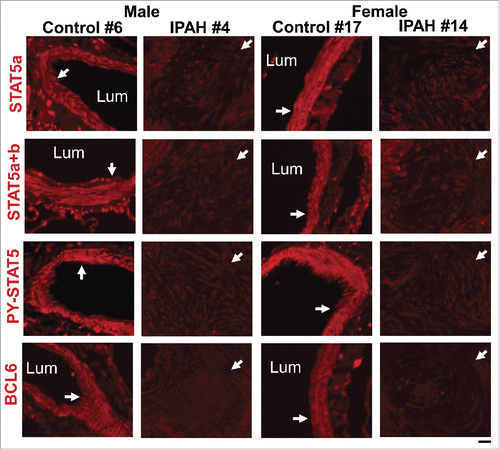
FIGURE 8. Representative immunofluorescence images showing coordinate reductions in STAT5a/b, PY-STAT5 and BCL6 in obliterative pulmonary arterial lesions in male and female patients with late-stage IPAH compared to control arterial walls (white arrows). The patient numbers correspond to the listing in Supplemental Table 2 in ref. Citation83. Scale bar = 50 µm.

FIGURE 9. The GH-STAT5-BCL6 neuroendocrine axis as it relates to sex-bias in the initiation and progression of the pathogenesis of pulmonary hypertension.
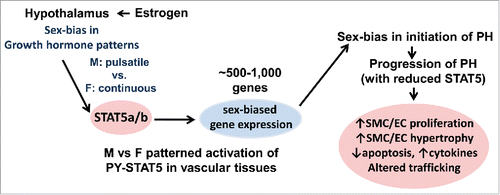
FIGURE 9. The GH-STAT5-BCL6 neuroendocrine axis as it relates to sex-bias in the initiation and progression of the pathogenesis of pulmonary hypertension.

Reprints and Corporate Permissions

Please note: Selecting permissions does not provide access to the full text of the article, please see our help page How do I view content?

To request a reprint or corporate permissions for this article, please click on the relevant link below:

Academic Permissions

Please note: Selecting permissions does not provide access to the full text of the article, please see our help page How do I view content?

Obtain permissions instantly via Rightslink by clicking on the button below:

If you are unable to obtain permissions via Rightslink, please complete and submit this Permissions form. For more information, please visit our Permissions help page.