Figures & data
Figure 1. Increased tumorigenesis in Il15−/− mice in a colitis-associated cancer model. Survival rates (A) of WT, Il15−/− and Il15rα−/− mice subjected to AOM/DSS treatment, were monitored. Colon weight (B), numbers of tumors per mouse (C), size (D) and location (E) of tumors were determined. Data represented as mean ± SEM of two independent experiments (WT n = 14, Il15−/− n = 11, Il15rα−/− n = 13). (F) Representative images of longitudinally cut colons from WT (n = 2), Il15−/− (n = 2) and Il15rα−/− (n = 2). (G) Representative H&E images of formalin-fixed tissues from proximal, mid and distal colonic regions. Dotted lines indicate adenomas with high-grade dysplasia. Insert enlarges a cancerous gland invading muscularis mucosa, with the overlying epithelium which is dysplastic. Scale bar: 600 μm, within the insert 200 μm. Mann–Whitney tests were used for statistical analysis.
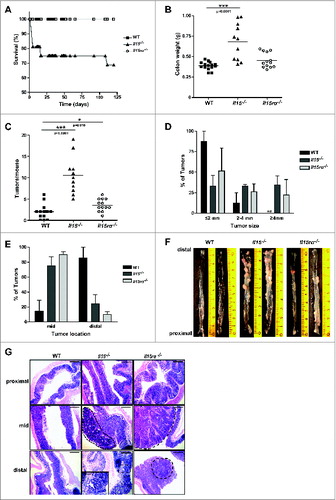
Figure 2. CD11c-Il15 mice showed restored CD8+ T and NK cells and serum levels of IFNγ, G-CSF, IL-10 and CXCL1. Mesenteric lymph nodes (mLN) and spleens were isolated from mice after completion of the AOM/DSS protocol. Total cell numbers and percentage of CD8+ T cells and NK cells were analyzed by flow cytometry in mLNs (A) and spleens (B). Lines show mean values with each point representing an individual mouse from three independent experiments (left panels) (WT n = 14, Il15−/− n = 14, Il15ra−/− n = 14, CD11c-Il15 n = 15) and two experiments (all other panels) (WT n = 9, Il15−/− n = 9, Il15ra−/− n = 7, CD11c-Il15 n = 5-8). Mann–Whitney tests were used for statistical analysis. (C) Sera was collected from mice after completion of the AOM/DSS protocol and cytokine/chemokines were quantified using the Bio-Plex array system (Bio-Rad). Lines indicate mean values with each point representing an individual mouse from two independent experiments (WT n = 22, Il15−/− n = 24, Il15rα−/− n = 20, CD11c-Il15 n = 18). Mann–Whitney tests were used for statistical analysis.
Figure 3. Restored IL-15 expression reduces tumor formation. Colons were isolated from mice following completion of the AOM/DSS protocol. Numbers of tumors per mouse (A) and size (B) were determined. In A, each point represents an individual mouse and in B data represent mean ± SEM of three independent experiments (WT n = 31, Il15−/− n = 32, CD11c-Il15 n = 28, Il15tg n = 11). Mann–Whitney test was used for statistical analysis. (C) Representative images of colons from WT (n = 2), Il15−/− (n = 2) and CD11c-Il15 (n = 2). (D) Representative H&E images of formalin-fixed tissues from proximal, mid and distal colon. Dotted line indicates the muscularis mucosa with the overlying colon adenoma showing high-grade dysplasia. Dashed lines enclose colon adenomas with high-grade dysplasia. Scale bar: 600 μm. (E) Percentages of tumor-types (low-grade dysplasia, high-grade dysplasia, intramucosal carcinoma, adenocarcinoma) in Il15−/− vs. CD11c-Il15 mice (Il15−/− n = 26, CD11c-Il15 n = 12).

Figure 4. IL-15 is expressed in human colorectal cancer. (A and B) IL-15 immunostaining in CAC cases. In A, faint cytoplasmic IL-15 immunostaining in CAC4 (IL-15 Score:1). In B, arrows denote cancerous glands with intense membranous/cytoplasmic immunostaining. (CAC n = 10). (C and D) Representative images of CAC expressing intense cytoplasmic/membranous IL-15 immunostaining (C, CAC6, Score:9), SCRC carcinoma exhibiting faint IL-15 immunostaining (D, SColon48, Score:2), Case SColon6 (E), exhibiting intense IL-15 immunostaining (low IL-15 score; score:9) and case SColon16 (F) displaying faint IL-15 immunostaining (high IL-15 score; score:2). (CAC n = 10 and Scolon n = 74). Arrows indicate cancerous glands with intense membranous/cytoplasmic and double arrows depict nuclear IL-15 immunostaining. Scale bar: 50 μm.
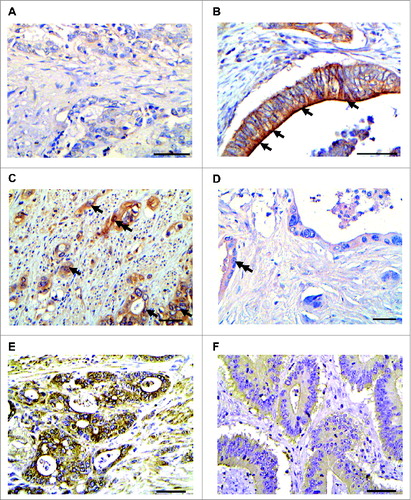
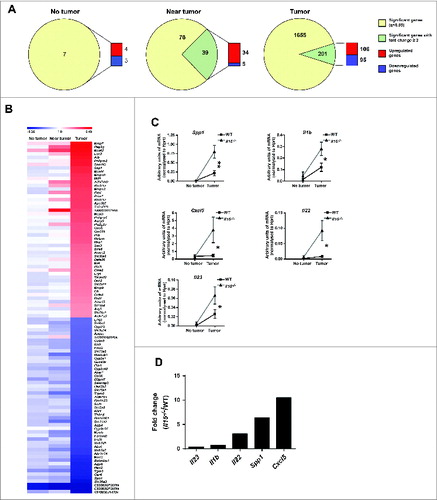
Figure 5. Differentially-expressed genes profiles in WT and Il15−/− colon tissues. RNA from no tumor, near tumor and tumor colon tissue from WT and Il15−/− mice were used for gene expression analysis by microarrays. (A) LIMMA analysis of differentially expressed genes showing a q value < 0.05 and a log2 fold change (FC) ≥2. Pie charts show the number of significant genes (yellow) and the number significant genes that exhibit a fold change ≥2 (green). The green gene pool was used to determine the proportion of upregulated (red) and downregulated (blue) genes. (B) Fold change of top 50 upregulated and downregulated genes. Comparative heat map shows the fold change of the gene expression between WT and Il15−/− mice from no tumor, near tumor and tumor tissue from colon sections. Red and blue color intensity indicates the degree of upregulated and downregulated genes, respectively (WT n = 3, Il15−/− n = 3). The lists of genes are shown in Table S3. (C) qRT-PCR analysis showing the level of mRNA expression of indicated genes in normal and tumor tissue from WT and Il15−/− mice relative to Hprt. Data are shown as mean ± SEM of WT n = 14-17, Il15−/− n = 14-17. Results are from three independent experiments. (D) Mean fold change increase of expression levels of genes in Il15−/− vs. WT tumor tissues normalized to their respective non-lesional tissue. Mann–Whitney tests were used for statistical analysis.