Figures & data
Figure 1. NK cells from Tlr3−/− mice display defective cytokine production. NK cells were purified from the spleens of wild-type (WT) or Toll-like receptor 3 null (Tlr3−/−) mice and cultured together with variable concentration of recombinant (r) IL-12 with constant 50 ng/mL rIL-18 or with variable concentration of rIL-15 with constant concentration of 1 ng/mL rIL/12 (A, D, and E), with 500 pg/mL of rIL-12 combined with 50 pg/mL of rIL-18 (C, F) or with 10 ng/mL of PMA together with 1 μg/mL of ionomycin (B). After 16 to 20 h, supernatants were collected and IFNγ (A, B), MIP-1α (E) or MIP-β, RANTES, IL-6 and GM-CSF (F) production was assessed by CBA. Alternatively, cells were stained and NK cell activation (C) or IFNγ production (D) were analyzed by immunofluorescence staining and cytofluorimetric analysis. Data shown are representative of at least 2 independent experiments and presented as mean ± SD of 3 experimental replicates. The Mann-Whitney test was used to compare differences between WT and TLR3-/- NK cells; **P < 0.01; ***P < 0.001).
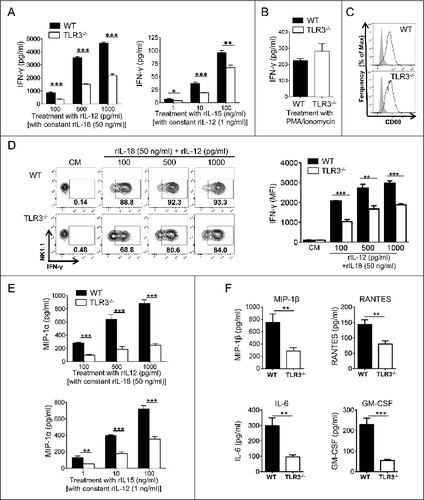
Figure 2. TLR3 is not required for NK cell development and acquisition of killing capacity. Bone marrow (BM), liver, lung and spleen from wild-type (WT) and Toll-like receptor 3 null (Tlr3−/−) mice were processed and the percentages (A) and maturation status (B) of natural killer (NK) cells (CD3− NK1.1+) were determined by flow cytometry. (C) Expression of activating and inhibitory receptors on splenic NK cells from WT (red) or Tlr3−/− mice (blue). Data shown are representative of 2 independent experiments each consisting of 3 mice per group. (D, E) Purified splenic NK cells from WT or Tlr3−/− mice were cultured for 3–5 d together with 10 ng/mL of IL-15/IL-15Rα. (D) NK cells were incubated in anti-NK1.1 or anti-Ly49D coated plates for 6 h and degranulation (measured by CD107a exposure) and IFNγ production were assessed by flow cytometry. Representative dot plots are depicted and graphs represent mean ± SD of pooled data from 2 (anti-Ly49D) to 3 (anti-NK1.1) experiments done in 3 to 5 experimental replicates. The Mann-Whitney test was used to compare difference between WT and TLR3-/- NK cells. Black bars: WT, White bars: TLR3-/-. (E) Cytotoxic activity against YAC-1 or B16F10 cells was determined in a standard 4 h 51Cr release assay. Graphs represent mean ± SD of triplicates from one experiment representative of 3 independent experiments.
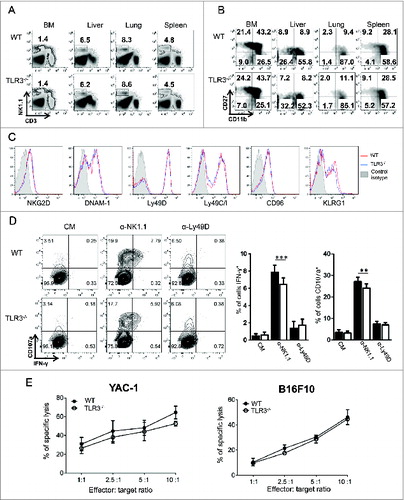
Figure 3. TLR3 expression on immune cells other than CD8α DCs is required for the acquisition of full NK cell functions. (A) Lethally irradiated wild-type (WT) mice were reconstituted with bone marrow (BM) cells from WT or Toll-like receptor 3 null (Tlr3−/−) mice. Alternatively, lethally irradiated Tlr3−/− mice received BM cells from WT or Tlr3−/− mice. Eight weeks later, natural killer (NK) cells were isolated from the spleen, cultured for 16 to 20 h together with 50 ng/mL of rIL-18 and variable concentrations of rIL-12. IFNγ production was determined by immunofluorescence staining and flow cytometry. Graphs and dot plots showing mean ± SD of experimental triplicates from one representative experiment out of 2 are depicted. (B) TLR3 expression by splenic natural killer T (NKT) cells (TCRβ+ CD1d/α-GalCer tetramer+), NK cells (CD3− NK1.1+), γδ T cells (TCRγδ+ CD3+), CD4 T cells (TCRβ+ CD4+), CD8 T cells (TCRβ+ CD8+), B cells (CD19+ B220+), macrophages (CD11b+ F4/80+), monocytes (CD11b+ Ly6Chigh), neutrophils (CD11b+ Ly6G+), CD8α− DC (CD11c+ MHC-II+ CDα8−) and CD8α+ (CD11c+ MHC-II+ CD8α+) from WT mice was determined by intracellular staining. (C-E) NK cells were purified from the spleen of WT, TLR3−/− and Batf3−/− mice and cultured in the presence of 100 pg/mL of rIL-12 and 50 ng/mL of rIL-18 for 16 h. IFNγ production was determined by flow cytometry (C, D) and by Cytometric Bead Array (CBA) (E). Representative dot plots and graphs showing the mean ± SD of triplicates from one experiment representative of 3 independent experiments are depicted. The Mann-Whitney test was used to compare differences between mice in A, D and E; *P < 0.05; **P < 0.01; ***P < 0.001.
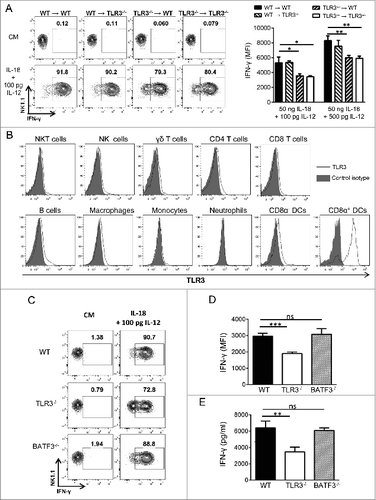
Figure 4. NKG2D-mediated suppression of tumor is attenuated in Tlr3−/− mice. Wild-type (WT) or Toll-like receptor 3 null (Tlr3−/−) mice were injected s.c. with (A) RMAS-MSCV or (B) RMAS-Rae1β tumor cells and tumor size was recorded. Data shown are representative of 2 independent experiments with 5–10 mice per group and presented as mean ± SEM. The Mann-Whitney test was used to compare differences between mice; **P < 0.01; *P < 0.05.
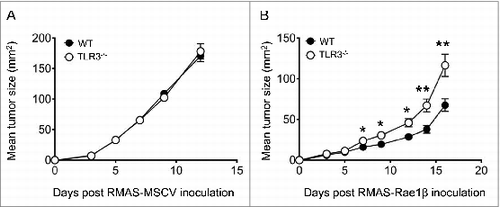
Figure 5. TLR3 is dispensable for the control of primary tumor growth and carcinogenesis. Wild-type (WT) and Toll-like receptor 3 null (Tlr3−/−) mice were injected s.c. with (A) B16F10 or (B) MC38 tumor cells (n = 5 mice per group). (C) Mice were orthotopically injected into the mammary fat pad with E0771 cells (n = 10 mice per group). Data shown are representative of 2 independent experiments and presented as mean ± SEM. (D) WT and Tlr3−/− mice were injected with 100 µg of MCA and subsequently monitored for tumor development over 300 d. Results are pooled from 2 independent experiments with a total of 26 WT and 31 Tlr3−/− mice. Statistical differences in tumor incidence were determined by Mantel Cox Log-rank test.
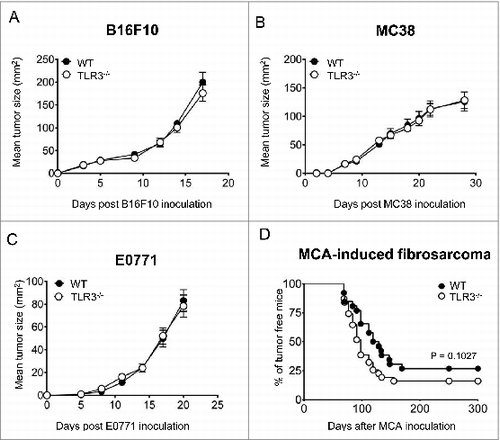
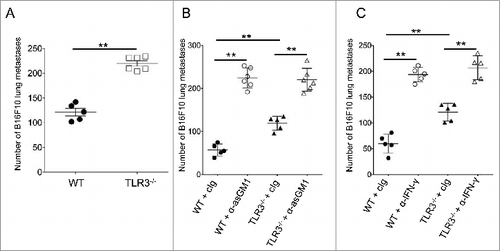
Figure 6. TLR3 participates in the control of metastasis in a NK cell- and IFNγ-dependent manner. (A-C) Wild-type (WT) and Toll-like receptor 3 null (Tlr3−/−) mice were challenged i.v. with B16F10 melanoma cells. For some experiments, mice were treated with natural killer (NK) cell-depleting anti-asialo-GM1 antibodies (B) or blocking antibodies against IFNγ (C). Symbols represent the number of lung metastases for individual mice 14 d following tumor inoculation. The Mann-Whitney test was used to compare differences between mice; **P < 0.01).