Figures & data
Figure 1. TRX is highly expressed in human melanoma and positive related to tumor progression. (A) Immunohistochemistry (IHC) staining of thioredoxin (TRX) in human melanoma samples and control nevus. 1–10: nevus, 11–20: primary melanoma, 21–30: metastasis melanoma. Scale bar, 100 μm. (B-D) Histogram graph showing the quantitative evaluation of TRX staining intensity from . Statistical analysis was performed by Student's t-test; *P < 0.05. T-Primary tumor, T0-No evidence of primary tumor, Tis-Carcinoma in situ; intraepithelial or invasion of lamina propria, T1-Tumor invades submucosa, T2-Tumor invades muscularis propria, T3-Tumor invades through muscularis propria into subserosa or into non-peritonealized pericolic or perirectal tissues, T4-Tumor directly invades other organs or structures and/or perforates visceral peritoneum. N-Regional lymph nodes, N0-No regional lymph node metastasis, N1-Metastasis in 1 to 3 regional lymph nodes, N2-Metastasis in 4 or more regional lymph nodes. M-Distant metastasis, M0-No distant metastasis, M1-Distant metastasis. (E) Relative serum TRX protein levels from nevus, primary melanoma and metastatic melanoma patient groups as determined by ELISA. Statistical analysis was performed by Student's t-test; *P < 0.05.
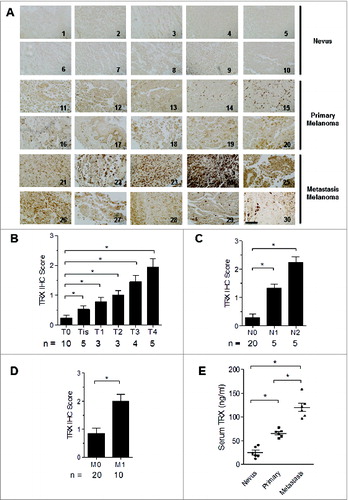
Figure 2. TRX levels correlate with the Treg number in the tumor microenvironment to inhibit T-cell response. (A) Western bolt analysis of thioredoxin (TRX) protein level in B16 cells transfected with empty vector (Mock) or pcDNA3.1-TRX overexpression (OE) or TRX shRNA knockdown (KD). (B) ELISA analysis of TRX protein level in serum-free conditioned medium from transfected B16 cells cultured 24 h. (C) ELISA analysis of serum TRX protein level in blood sera of B16 tumor-bearing mice. (D) Metastatic tumor size in lung from B16 cell tumor-bearing mice (n = 6). (E) Representative image of lung metastases from B16 tumor bearing mice at day 30. (F-H) ELISA analysis of serum interferon γ (IFNγ), interleukin 10 (IL10) and transforming growth factor β (TGFβ) protein levels from tumor-bearing mice (n = 6) 20 d after B16 cell injection. (I) Transfected B16 cells were injected into C57/B6 mice for 3 weeks then tumor-infiltrating regulatory T cell (Treg) numbers per 200 mg tumor sample were calculated in tumor-bearing mice (n = 6) by immunofluorescence staining and cytofluorimetric analysis. Statistical analysis was performed by Student's t-test; *P < 0.05.
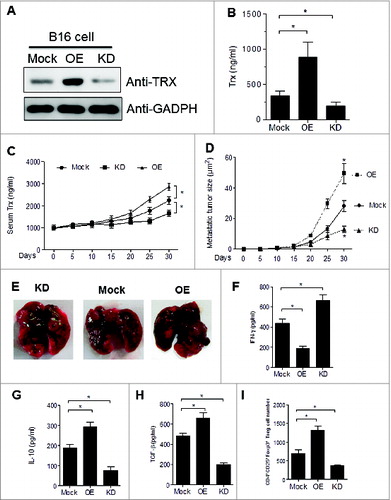
Figure 3. Tregs are enriched in the melanoma microenvironment. (A) Cells from melanoma (and nevi control) patient samples immunostained for CD25 and FOXP3 and analyzed by cytofluorimetric analysis. (B) FACS analysis of CD4+CD25+FOXP3+ Treg cell numbers in melanoma patient tumor samples and control nevus. (C-D) FACS analysis of CD4+CD25+FOXP3+ Treg cell numbers in different stage of melanoma samples. N0-No regional lymph node metastasis, N1-Metastasis in 1 to 3 regional lymph nodes, N2-Metastasis in 4 or more regional lymph nodes. M-Distant metastasis, M0-No distant metastasis, M1-Distant metastasis. (E) Correlation analysis between TRX immunohistochemistry (IHC) score and the number of infiltrating Tregs in human melanoma samples and control nevus samples. Statistical analysis was performed by Student's t-test; *P < 0.05.
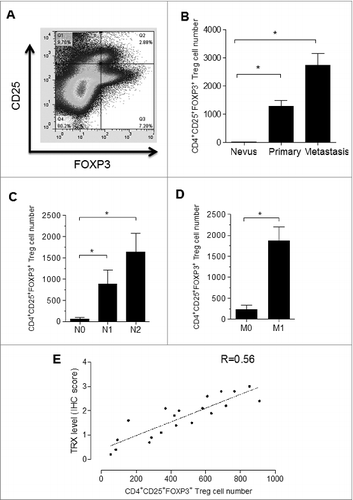
Figure 4. Chemotactic effect of TRX on Tregs in vitro and in vivo. (A) Regulatory T cell (Treg) migratory capacity toward control 3T3 cell or B16 cell conditioned medium (CM) by transwell assay for 2, 4, 8 h. (B) Treg migration toward CM from B16 cells upon addition of 1–20 ng/mL TRX for 8 h. (C) Treg migration toward CM from B16 cells when 1 mg/mL anti–TRX or a control lgG antibody was added in the medium for 8 h. (D) Treg cell number in the local tumor upon injection with 500 ng/mL TRX as determined by immunofluorescence staining and cytofluorimetric analysis (n = 5). (E) Treg cell number in the local tumor upon injection with 5 mg/mL anti–TRX antibody or a control lgG antibody for 4 h as determined by immunofluorescence staining and cytofluorimetric analysis (n = 5). (F) Cell migration index analysis of Treg cells isolated from B16 tumor bearing mice (n = 5). Mock = B16 transfected with empty vector, OE = B16 transfected pcDNA3.1-TRX, KD = B16 transfected with TRX shRNA vector. Statistical analysis was performed by Student's t-test; *P < 0.05.
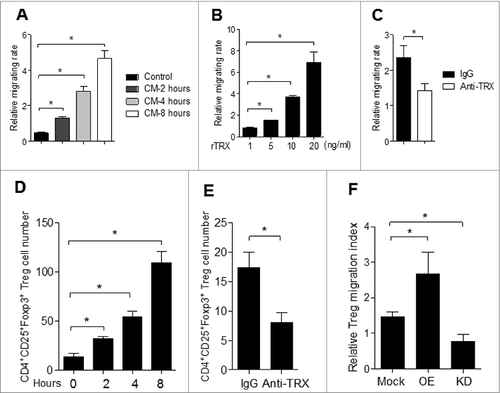
Figure 5. TRX induces conversion from conventional T cells (Teff) to Treg. (A) Immunofluorescence staining and cytofluorimetric analysis to determine the number of CD4+CD25+ Foxp3+T cells arising upon culture of isolated CD4+CD25− T cells with B16 cell conditioned media (CM) in the presence of anti-CD3/CD28 antibodies and 500 U/mL interleukin (IL)-2 for 1–4 d. (B) FACS analysis of CD4+CD25+Foxp3+ and CD4+CD25− Foxp3− T cell ratio when cultured with B16 cell CM in the presence of anti-CD3/CD28 antibodies and 500 U/mL IL-2 for 1–4 d. (C) ELISA measurement of interferon γ (IFNγ), IL-10 and transforming growth factor β (TGFβ) protein levels secreted by isolated CD4+CD25− T cells cultured with B16 cell CM for 4 d. (D) Ratio of Tregs arising in isolated CD4+CD25− T cells cultured with B16 cell CM in the presence of reduced thioredoxin (rTRX) as determined by FACS (n = 3). (E) Ratio of Tregs arising from isolated CD4+CD25− T cells cultured with B16 cell CM in the presence of 1 mg/mL anti-TRX antibody or control lgG antibody (n = 3).
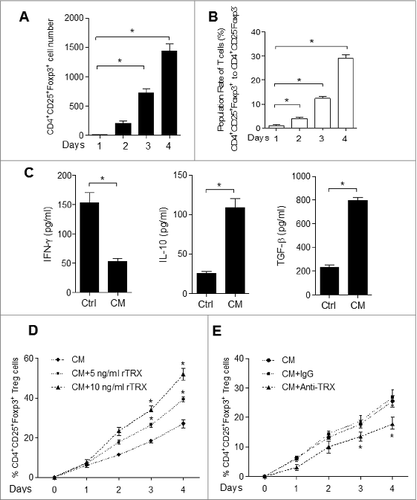
Figure 6. TRX confers Treg enhanced tolerance to oxidative stress in melanoma. (A) Reactive oxygen species (ROS) level in B16 tumor-bearing mice tumor interstitial fluid (n = 3) determined by Acridan Lumigen PS-3 reagent. (B) Cell apoptosis was determined by propidium iodide (PI) and AnnexinV staining and cytofluorimetric analysis of freshly isolated regulatory T cell (Tregs) and effector T (Teff) cells cultured in the presence of tumor interstitial fluid (n = 3). (C-D) Cell apoptosis (PI and AnnexinV staining) of freshly isolated Tregs cultured in the presence of tumor interstitial fluid plus either (C) 10 ng/mL reduced thioredoxin (rTRX; n = 3) or (D) 1 mg/mL anti-TRX antibody (n = 3). (E) FACS analysis of Teff and Treg apoptosis in isolated cells from B16 tumor-bearing mice per 200 mg tumor sample (n = 5). (F) FACS analysis of Treg apoptosis in isolated cells from TRX-overexpressing (OE) and TRX knockdown (KD) B16 tumor-bearing mice per 200 mg tumor sample (n = 5). Statistical analysis was performed by Student's t-test; *P < 0.05.
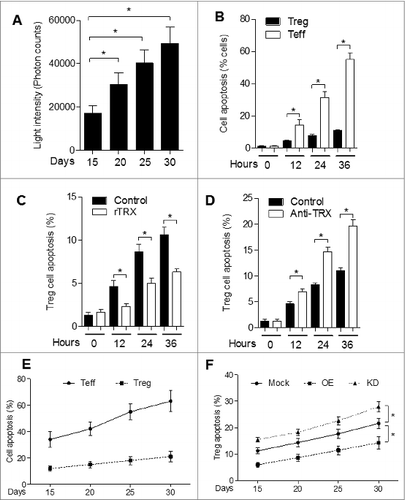
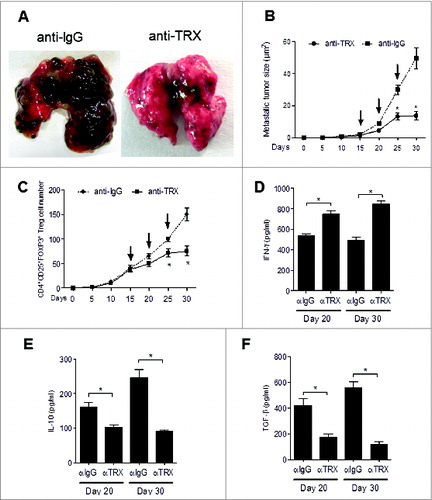
Figure 7. Therapeutic effect of anti-TRX antibody on metastatic melanoma. (A) Representative image of lung metastases from B16 tumor-bearing mice after tail vein injection of anti-lgG antibody or anti-TRX antibody at day 30. (B) Metastatic tumor size in lung from B16 tumor bearing mice (n = 5) after tail vein injection of anti-lgG antibody or anti-TRX antibody (arrows, at day 15, 20, 25). (C) Treg cell numbers were calculated from 200 mg mouse metastatic lung tissue from B16 tumor bearing mice (n = 5) after tail vein injection of anti-lgG antibody or anti-TRX antibody (at day 15, 20, 25) by immunofluorescence staining and cytofluorimetric analysis. (D-F) ELISA analysis of serum interferon γ (IFNγ), interleukin 10 (IL10) and transforming growth factor β (TGFβ) protein levels in B16 tumor-bearing mice (n = 5) after tail vein injection of anti-lgG (αlgG) antibody or anti-TRX antibody (αTRX) at day 20 or day 30. Statistical analysis was performed by Student's t-test; *P < 0.05.