Figures & data
Figure 1. Fibrocytic cells at the tumor site exhibit similar –but not the same– surface expression characteristics to the circulating fibrocytes. (A) Expression profiles of CAF cells for MHC Class II (i), CD80 (ii), CD11b/c (iii), CD172a (iv), CD103 (v), RT1B (vi), HIS48 (vii) and expression profiles of NF cells for MHC Class II (i), CD11b/c (iii), CD172a (iv) are shown. Fibroblast cells in cultures were evaluated for morphological features,Citation76 immunocytochemical characteristics; and microscopic confirmation was achieved before the experiments. Fibroblast cells were previously reported to show a wide range of variation in terms of size and granularity in flow cytometric evaluations.Citation77,78 Our studies also demonstrated that forward and side scatter characteristics of NF and CAF cells do not represent a single distinct population based on size and granularity; thus, cannot be used as a sensitive and specific gating strategy as in the case of the lymphocyte gate (Fig. S1). As reported previously,Citation78 fibroblast cells were gated on scatterplot of side light scatter vs. forward light scatter, allowing for gating of only the viable cell population, excluding cellular debris after doublet discrimination. Heavily shaded (dark gray) areas represent background fluorescence on the designated population as indicated by suitable isotype controls. Unshaded (white) areas represent breast tumor-derived CAF cells and lightly shaded (light gray) areas represent NF cells acquired from healthy donors. CAFs were shown not to express CD80, CD103, RT1B or HIS48. On the other hand, CAFs were shown to express MHC class II, CD11b/c and CD172a and their expressions of these molecules were lower than that of NF cells. Representative flow cytometry plots of more than three experiments are shown. (B) Comparison of MFI values of surface expressions of CAF vs. NF cells. There were statistically significant differences between CAF and NF expressions of MHC Class II (p = 0.024) (i), CD11b/c (p = 0.036) (ii) and CD172a (p=0.024) (iii). Columns and error bars designate means and SEM, respectively. The results were derived from more than three experiments. CAF: Cancer Associated Fibroblast, NF: Normal Tissue Fibroblast, MFI: Median Fluorescence Intensity, SEM: Standard Error of Mean.
Figure 2. Fibrocytic cells mediate immune suppression. (A) Vimentin stained NF (i) and CAF (ii) cells from representative samples (original magnification x200 under light microscope and visualized by DAB). CAF and NF cells were immunostained to show their surface expressions of vimentin, in order to clearly visualize their morphologies and expression characters. Both of these spindle shaped cell types stained uniformly for the mesenchymal marker vimentin, as expected.Citation38 (B) Suppression of PHA mediated PBMC proliferation by fibrocytic cells. 20.26% of PBMCs cocultured with CAFs (white line) proliferated in contrast to the proliferation of 37.80% of PBMCs cocultured with NFs (gray line). Thus, CFSE proliferation assays showed the immunosuppressive effect of CAFs compared to NFs. A representative histogram of three experiments performed using PBMC from three separate rats is shown (see Fig. S2 for positive and negative controls and Fig. S4 for the effect of the number of CAF cells). CAF: Cancer Associated Fibroblast, NF: Normal Tissue Fibroblast, w/: Coculture with the designated cells, DAB: Diaminobenzidine, PHA: Phytohemagglutinin, PBMC: Peripheral Blood Mononuclear Cell, CFSE: Carboxyfluorescein Succinimidyl Ester.
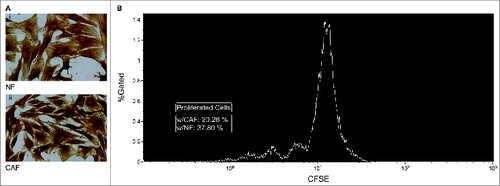
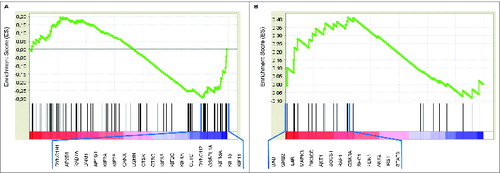
Figure 3. Genes involved in MHC class II antigen presentation were under-expressed and genes related to IL-4 signaling were upregulated in CAFs compared with NFs. (A) Enrichment plots of GSEA of CAFs vs. NFs for the REACTOMEMHC_CLASS_II_ANTIGEN_PRESENTATION (NES: –1.27, FDR: 0.062) and (B) SIG_IL4RECEPTOR_IN_B_LYPHOCYTES (NES: 1.21, FDR: 0.201) gene sets are shown. Gene expression data was acquired from NCBI Gene Expression Omnibus (GSE21440) and GSEA was performed as described previously.Citation31 Genes that contribute to the leading-edge subsets within each gene set (20 and 14 genes, respectively) are listed below the figures. These GSEA results are consistent with our flow cytomery findings concerning MHC Class II and CD172a expressions of CAF and NF cells. CAF: Cancer Associated Fibroblast, NF: Normal Tissue Fibroblast, GSEA: Gene Set Enrichment Analysis, NES: Normalized Enrichment Score, FDR: False Discovery Rate.