Figures & data
Figure 1. Irradiation enriches for cells with a CSC phenotype from primary solid tumors. (A) Indicated human tumor cell lines, were exposed to 4–10 Gy γ-irradiation, and then assessed for the percentage of remaining cells expressing a stem-like phenotype by ALDH expression 18–24 h later by flow cytometry. (B) ALDH expression of dissociated A673 xenograft tumors 48 h after 8 Gy local radiotherapy in vivo. (C–E) H&E staining of primary human pancreatic adenocarcinoma (FPA2), Ewing's sarcoma (SA2) and leiomyosarcoma (SA4). (F–H) Primary tumor specimens in C–E were given 8 Gy γ-irradiation, then assessed for stem-like phenotypic markers by flow cytometry 18–24 h later. Stem-like cells in FPA2 were quantified as CD24+/CD44+/ALDHbright cells while stem-like cells from soft-tissue sarcoma samples FSA2 and FSA4 were quantified as ALDHbright cells. Statistical significance was determined by Student's t-test. * p < 0.05; ** p < 0.01, ***p < 0.001.
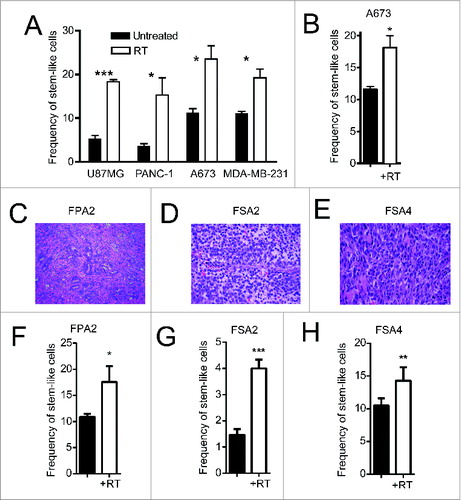
Figure 2. Irradiation increases the expression of NK cell ligands on stem-like tumor cells. (A, B) Fresh sarcoma specimen FSA4 was dissociated and exposed to 8 Gy γ-irradiation. Twenty-four hours later, tumors were assessed for fluorescent intensity of MICA/B and Fas by flow cytometry. (C) FSA4 cells were assessed for stem-like phenotypic markers and death markers by qRT-PCR. Data are presented as fold change compared to unirradiated samples. (D–F) Expression of MICA on irradiated tumor cells was assessed for ALDHbright (stem-like) and ALDHdim (non-stem like) populations from PANC-1 (D), A673 (E), and U87-MG (F). (G, H) FSA4 cells were exposed to 8 Gy γ-irradiation, then assessed for the expression of the NKG2D ligands MICA/B (E) or the death receptor Fas (F) by flow cytometry on stem and non-stem tumor populations. Stem-like populations in FSA4 were defined as ALDHbright whereas non-stem were defined as ALDHdim. Statistical significance was determined using a one-way ANOVA with multiple comparison test or Tukey post-test. *p < 0.05; **p < 0.01, ***p < 0.001.
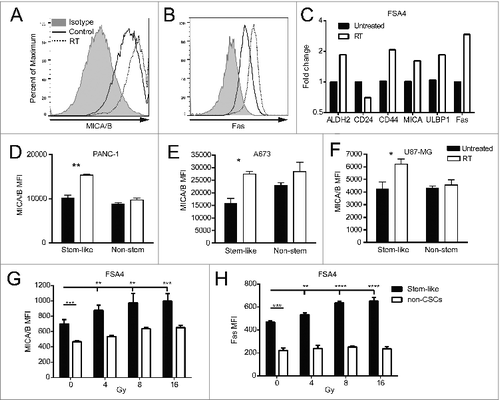
Figure 3. Patients treated with radiation therapy show enrichment for CSCs and NKG2D ligands. A cohort of 12 soft tissue sarcoma patients was biopsied before the start of neoadjuvant radiation therapy (RT) and compared with samples taken at the time of surgical resection. Alternatively, a separate cohort of eight patients who did not receive neoadjuvant treatment was assessed as a negative control. Tissue microarrays (TMA) were prepared from all patients and stained by IHC for ALDH1 and MICA/B. (A) Representative TMA punches pre- and post-RT showing changes in ALDH1 staining. (B) Changes in ALDH1 expression score as determined by a blinded clinical pathologist. ALDH1 staining intensity was scored from 0 to 4 and multiplied by the percentage of cells staining positive. (C) Representative TMA punches pre- and post-RT showing changes in MICA/B staining. (D) Changes in MICA/B expression score as determined by a blinded clinical pathologist scores (M.C.). MICA/B was scored based on staining intensity alone (from 0 to 4). (E, F) Fold change in ALDH1 scores and MICA/B scores was correlated among the RT treated cohort (E) or the untreated cohort (F). Statistics in B and D were performed by two-tailed Student's paired t-test.
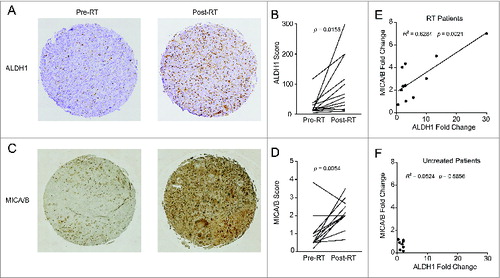
Figure 4. Irradiation sensitizes CSCs to NK cell attack in vitro and in vivo. (A, B) CSC frequency of indicated tumor cell lines, as assessed by ALDH activity, following 24 h incubation under the indicated treatment conditions. (C, D) CSC frequency of indicated primary tumor sample as assessed by flow cytometric analysis of CD24+/CD44+/ALDH bright (C) or ALDH bright (D) remaining following 24 h incubation under the indicated treatment conditions. (E–I) Numbers of CSCs remaining from experiments described in C and D. (H) Numbers of non-CSCs in primary pancreatic tumor sample, FPA2, after RT and with/without NK co-culture. (J) Frequency of CSCs (ALDH bright) remaining from patient-derived xenografts of the leiomyosarcoma, PDX-SA4, as assessed using flow cytometry, 5 d after the indicated treatments in vivo. (K) expression of CSCs as assessed by flow cytometric analysis of ALDH expression or CD24−CD44+ expression on patient-derived xenografts of the mammary carcinoma, PDX-BR1, 5 d after the indicated treatments in vivo. Statistical significance was determined by one-way ANOVA with a Bonferroni post-test where *p ≤ 0 .05; **p ≤ 0 .01, ***p ≤ 0 .001, and ****p ≤ 0 .0001.
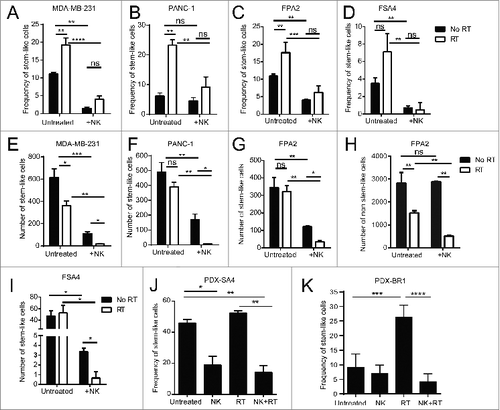
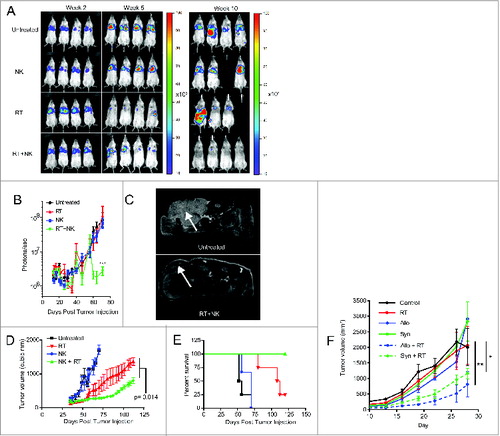
Figure 5. NK cells provide superior antitumor effects when combined with radiotherapy. (A) Representative bioluminescence images showing tumor burden at weeks 2, 7, and 10 after injection of luciferase transfected PANC-1 tumors. (B) Quantification of captured tumor burden as assessed in A. (C) Representative axial MRI images of mice bearing established orthotopic PANC-1 tumors assessed 14 d after NK cell infusion. Tumors are indicated with white arrows. (D) Tumor growth of subcutaneous PANC-1 xenograft tumors from indicated treatment groups as assessed by external caliper. (E) Kaplan–Meier curve displaying survival fraction of mice from experiments described in C. (F) Immune-competent BALB/c mice were injected subcutaneously with RENCA mouse renal carcinoma cells, administered local RT, then treated with 2 × 10⁷ activated C57BL/6 (allogeneic) or BALB/c (syngeneic) NK cells. Mice were monitored for tumor growth. All survival experiments were performed at least twice with four mice per group. Statistics were determined by two-way ANOVA with Bonferroni post-test or by Log-rank test where appropriate. *p < 0.05; **p < 0.01, ***p ≤ 0 .001.