Figures & data
Figure 1. Combination low dose bortezomib plus mapatumumab induce human myeloma cell apoptosis. (A) Six human myeloma cell lines were cultured for 48 h in triplicate wells in the previously determined sub-optimal btz dose, or increasing doses of Mapa (0.01–50 μg/mL) alone, or the combination of LDB+M. HMCL apoptosis was measured by annexin V binding and is presented as the mean ± SE of three separate experiments, * designates a statistical significant difference (where p = <0.05) in HMCL apoptosis between Mapa alone and the combination of Mapa and low dose bortezomib. (B) HMCL were either untreated, or treated for 24 h with LDB. TRAIL-R1 expression was determined by FACS staining. Data is shown as histogram overlays for each HMCL, and is representative of triplicate wells from three separate experiments showing constitutive TRAIL-R1 (thick black line), TRAIL-R1 after 24 h LDB treatment (dotted line), isotype control (shaded light gray) or secondary only control (dashed line). In brackets are MFI values for HMCL TRAIL-R1 expression after 24 h LDB treatment (Pre-btz) or untreated (U/T). In C, LP-1 cells were either untreated (black) or pre-treated with 5 nM Btz (white) for 24 h prior to the addition of Mapa (0.01–50 μg/mL) for 48 h. LP-1 apoptosis was measured by annexin V binding and is presented as the mean ± SE of three separate experiments, * designates a statistical significant difference (student t-test where p = <0.05) in LP-1 apoptosis between untreated versus LDB pre-treated cells.
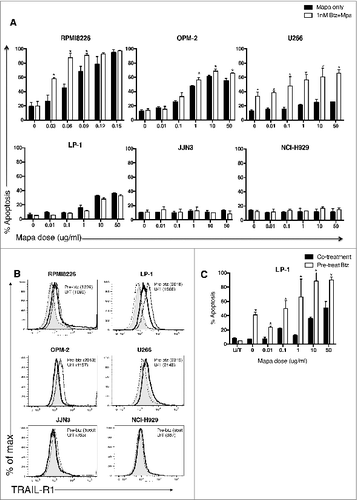
Figure 2. For figure legend, see next page. Figure 2 (See previous page). Combination LDB+M treatment of human myeloma cells induced increased MoDC cell phagocytosis, but does not affect MoDC response to the TLR ligand LPS. HMCL (U266 and RPMI8226) were labeled with the pH sensitive dye pHrodo, pre-treated with LD btz and Mapa for 48 h, then co-cultured with MoDCs (as per Methods). The kinetics of MoDC phagocytosis of apoptotic HMCLs was monitored by live video microscopy (A), then quantitated by flow cytometry (B). The effect of LDB+M combination or single drug treatment on MoDC responses to LPS were assessed in C and D. In C, changes in MoDC expression of CD80, CD86, CD83, HLA-ABC and HLADR and CD83 were investigated. Data shown is representative histogram overlays, and collated mean fluorescence intensity (MFI) data from triplicate wells of a single experiment. In D, MoDC secretion of IL-12p70 and IL-4 is shown. Data presented is either representative data from three separate experiments (A) and (C). Quantitative data in B and D is the mean ± SE for three separate experiments, p values (student t-test) are provided in B for test conditions that are significantly different to the control, and in D **** represents p < 0.0001.
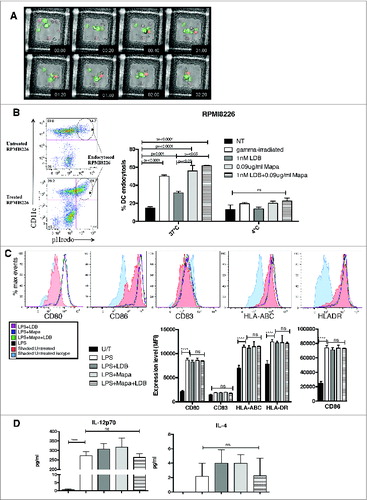
Figure 3. Combination LDB+M induced increased effector cell killing of human myeloma cells. HLA-A2*01 MoDCs were pulsed with apoptotic U266 cells (induced by LDB+M treatment) in the presence or absence of LDB+M. MM pulsed-DCs were then cultured with autologous PBMCs and the responder T cells expanded for 21 d in vitro (see Methods for details). The expansion of MM-specific effector cells was then assessed by CTL assay using Cr-labeled U266 cells as targets. Data presented is the percentage lysis (mean ± SE) of targets for three separate experiments on four HLA-A2*01 donors. Data series include four separate test conditions in the in vitro culture. These include DC pulsed with untreated or treated U266, DC pulsed with treated U266 in the presence of btz+Mapa, DC pulsed with treated U266 and then matured with LPS. Additional controls included ‘unloaded DC’ used at the priming phase in the culture (but U266 as targets in the killing assay), or control targets (autologous PBMC control) to show specificity of the AMCL response. A statistical (student t-test) difference in U266 lysis between the test and control combinations was shown, where * p < 0.05, and ** p < 0.01.
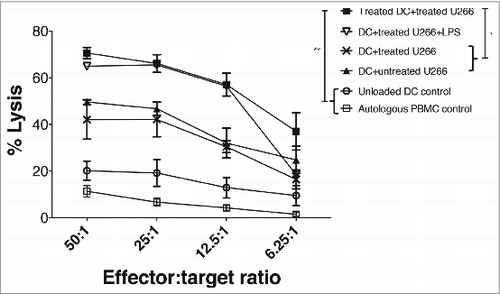
Figure 4. For figure legend, see next page. Figure 4 (See previous page). Combination LDB+Mapa treatment does not directly alter MoDC maturation or cytokine secretion. MoDCs were cultured with U266 myeloma cells and the effect of subsequent LDB+Mapa treatment on MoDC maturation compared to MoDCs activated with LPS. MoDCs were harvested at 4 and 24 h post drug or LPS treatment (as depicted in A) and assessed for the changes in the MoDC maturation markers CD80, CD40, CD83 and HLADR (B). Data show is protein expression assessed by FACS in mean fluorescence intensity (MFI). This is pooled data of therapy responses from three separate normal donor MoDC cultures. A statistically significant difference between test and control groups is represented by * (p < 0.05), **(p < 0.01), ***(p < 0.001). In addition, in C culture supernatant was collected from the co-cultures at 4, 8 and 24 h and cytokine levels (IL-12p70, IL-8, IL-4, GM-CSF, IL-1β, IL-6, IL-10 and sCD40 ligand) assessed by Luminex assay. In these co-culture conditions, ‘tr’ refers to cells treated with LDB+Mapa. Data is from triplicate wells of a single experiment, representative of two experiments.
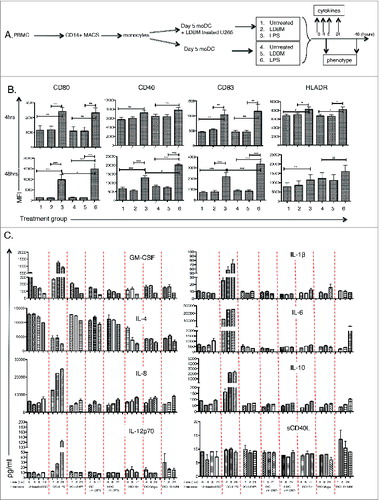
Figure 5. NK cells are required at the priming phase for efficient effector cell killing of human myeloma cells. A myeloma-specific effector cell culture was established as for . Thus, MM-pulsed MoDCs were co-cultured with autologous PBMCs for 7 d. In addition, monocytes or NK cells were depleted from the priming phase of the effector cell culture. MM-specific effector cells were expanded with re-stimulation and expansion steps up to day 21. Harvested effector cells were used in a killing assay with Cr-labeled U266 as targets (E:T = 25:1). Results presented are percentage lysis (mean ± SE), pooled data from three separate experiments. Where a statistical difference (student t-test) in U266 killing was observed ** p = <0.005, ***p = <0.0005, ****p = <0.0001.
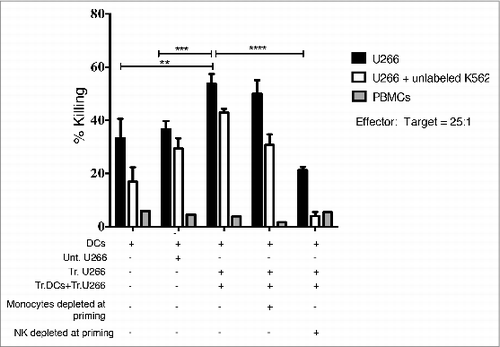
Figure 6. Myeloma induced activation of NK cells is increased by Mapatumumab pre-treatment. U266 myeloma cells were either untreated, or treated with LDB, Mapa or LDB+Mapa for 48 h (as per methods) and the effect of drug treatment on myeloma cell immunogenicity assessed by FACS for expression of CD80, CD86, CD83, HLA-ABC, HLA-DR (A). The effect of drug treatment on myeloma cell NK cell activating ligand expression was also investigated (B). NK activating ligands included the NKG2D ligands MIC-A, MIC-B, ULBP-1, ULBP-2,5,6 and the DNAM-1 ligands CD155 and CD112. Data is presented as representative histogram overlays for the isotype control (filled light gray), untreated (filled dark gray), Mapa (black dotted line), LDB (black line), or LDB+Mapa (black dashed line) treated U266 cells. In addition, in B a statistical comparison was made between treatment groups for NK cell activating ligand expression. In C at 48 h, the treated U266 cells were also co-cultured with HLA-A2+ PBLs. Cells were harvested at 4 (A) or 24 (B) h and the effect of drug treated myeloma cells on NK cell and T cell subset activation assessed by CD69 and CD25 expression. Data is presented for triplicate wells in a single experiment, representative of two separate experiments.
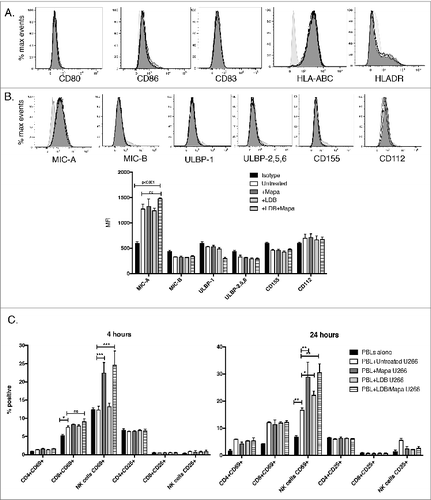
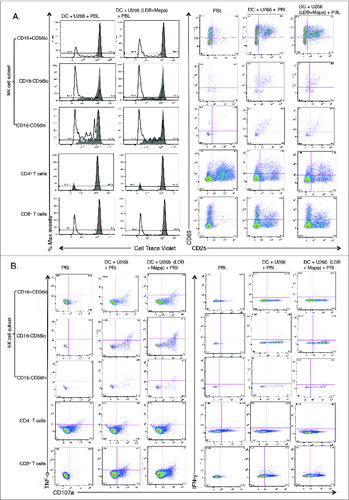
Figure 7. For figure legend, see next page. Figure 7 (See previous page). Myeloma-pulsed DCs induce increased activation of autologous NK, CD4+ and CD8+ T cells. Monocyte-derived DCs were pulsed with untreated or drug (Mapa, LDB or LDB+Mapa) treated U266 cells (as per methods) for 2 h, then co-cultured with autologous normal donor (n = 2) PBLs for a further 24 h. Cells were collected at 4 and 24 h, and activation of NK cells and T cell subsets assessed by CD69 and CD25 expression. Data presented in A are representative dot plots of NK and T cell activation in cultures from a single normal donor. Shown are PBL alone, PBL+DC, PBL+U266 pulsed MoDC (where U266 were pre-treated with LDB+Mapa), and PBL+U266 pulsed MoDC in the context of 1 μg/mL LPS. Collated data in B is from duplicate co-culture wells (single normal donor representative of two normal donor experiments) and shows the percentage of CD25−CD69+, CD25+CD69+ and CD25+CD69− cells in NK cell subsets, CD4+ and CD8+ T cells.
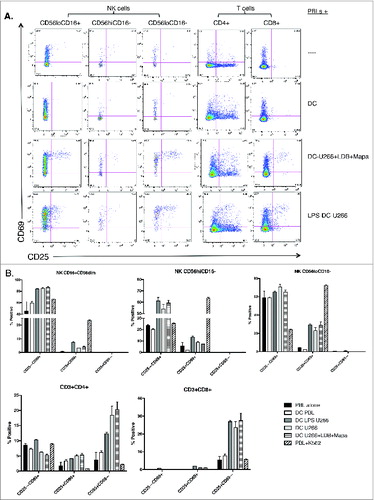
Figure 8. For figure legend, see next page. Figure 8 (See previous page). Myeloma-pulsed DCs induce increased proliferation of NK cells, CD4+ and CD8+ T cells. Monocyte-derived DCs were pulsed with untreated or drug (Mapa, LDB or LDB+Mapa) treated U266 cells (as per methods) for 2 h, then co-cultured with autologous normal donor (n = 2) PBLs (pre-labeled with Cell trace Violet, CTV) for 7 d. Cells were harvested, labeled with conjugated antibodies and analyzed on the FACS. In A, the proliferation and activation status of NK and T cell subsets was shown by gating first on lineage markers (NK subsets: CD56hiCD16−, CD16-CD56lo,CD56loCD16+, and T cells CD3+CD4+and CD3+CD8+) followed by CTV dilution (left panels) or CD69,CD25 expression (right panels). Cell proliferation data is shown as individual histogram overlays with the PBL alone control (filled light gray) with the test groups (thick black line) either PBL+U266-pulsed MoDC or PBL+U266 pulsed MoDC (where U266 were pre-treated with LDB+Mapa). In B day 7 cells were recovered from the co-culture and stimulated by co-culture for 4 h, cells were stained for activation markers (CD25,CD69), degranulation (CD107a), and cytokines (IFNγ and TNF-α). Data is presented as dot plots showing CD107a expression and TNF-α (left panel) or IFNγ (right panel) production by NK or T cell subsets.