Figures & data
Table 1. Distribution of demographic and clinical characteristics of patients in the control and cellular immunotherapy (CIT) groups
Table 2. Distribution of demographic and clinical characteristics of patients in the CIK and CIK+NK groups
Figure 1. Phenotypic analysis of immune cells after expansion. (A) The percentage of CIK cells (CD3+CD56+) after induction in one of the patients. (B) The percentage of NK cells (CD3–CD56+) after the 14-d culture.
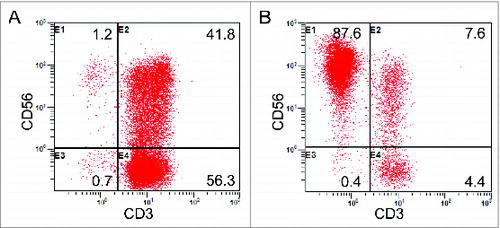
Figure 2. Survival analysis in patients with NSCLC. (A) Overall survival curves for NSCLC patients (n = 120) who received adjuvant cellular immunotherapy (CIT) combined with chemotherapy (CIT group, n = 60) or chemotherapy alone (control group, n = 60). (B) Overall survival curves for NSCLC patients who received adjuvant CIK cell treatment (CIK group, n = 33), adjuvant CIK cell and NK cell treatment (CIK + NK group, n = 27), or chemotherapy alone (control group, n = 60).
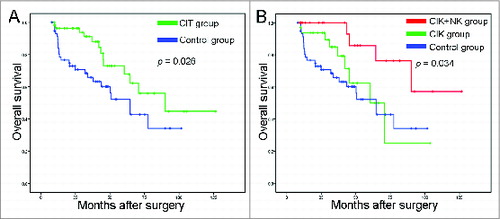
Table 3. Univariate and multivariate analysis of overall survival in patients with NSCLC
Table 4. Univariate and multivariate analysis of overall survival for patients in the CIK and CIK+NK groups
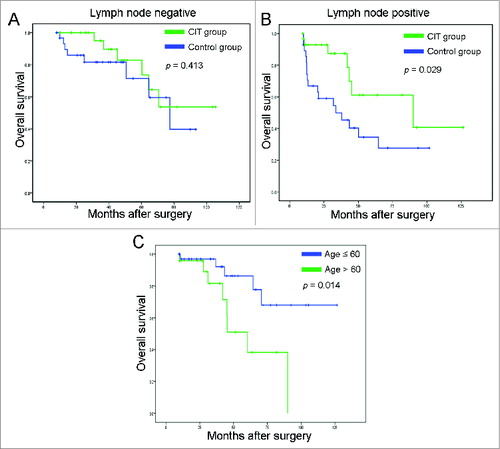
Figure 3. Subgroup analysis to estimate the benefits of additional cellular immunotherapy (CIT). (A) Overall survival curves for NSCLC patients with lymph node negative (n = 61) who received adjuvant CIT combined with chemotherapy (CIT group, n = 29) or chemotherapy alone (control group, n = 32). (B) Overall survival curves for NSCLC patients with lymph node positive (n = 59) who received adjuvant CIT combined with chemotherapy (CIT group, n = 31) or chemotherapy alone (control group, n = 28). (C) The Kaplan-Meier method was used to compare the overall survival rates between the ≤ 60-y-old group (n = 36) and > 60 age group (n = 24).