Figures & data
Figure 1. Interactions between CD40B cells and CTLs are short-lived. Cyclin D1-specific T cells were embedded in 3D collagen matrices together with different APCs: resting B cell (B cell), CD40B cells (CD40B), immature (DCimm) and mature (DCmat) DCs. APCs were pulsed with 10 µg/mL of the peptide cyclinD1_228 were indicated. Cell movements were recorded by time-lapse video microscopy and the duration of individual T cell-APC contacts was analyzed. (A) Each dot represents one contact. Bars represent the median. *p < 0.001. Data are pooled from 34 films from 9 independent experiments. (B) The percentage of cell contacts that last longer than 45 min of all contacts are shown. *p < 0.002.
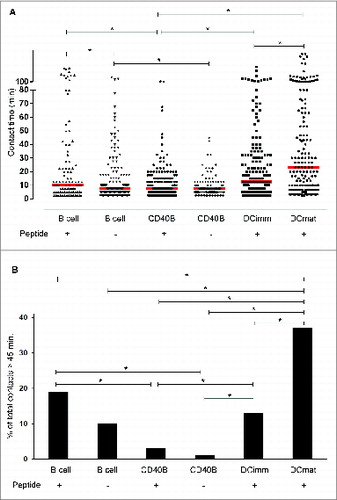
Figure 2. CD40B cells express crucial molecules for homing in to secondary lymphoid organs. Purified B cells were stimulated with tmuCD40L HeLa in the presence of rmIL-4. After 3 d, cells were stimulated with fresh CD40L and rmIL-4. (A and B) The B cells were phenotyped for the indicated molecules before stimulation with CD40L and (C) on day 7 of culture. Expression on cells gated for B220+ CD3− is presented in the histograms. Shaded histograms represent staining with isotype matched control antibodies; black lines staining with specific antibody. One representative experiment out of 9 is shown.
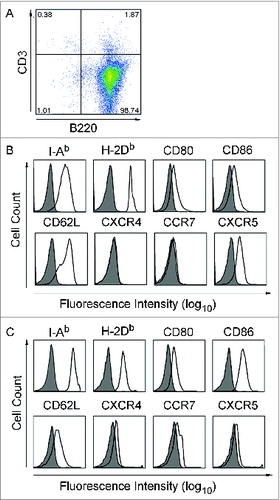
Figure 3. Chemokines involved in lymphocyte positioning in the secondary lymphoid organs. CCL21/ CCL19, chemokines expressed in the T-cell zones of secondary lymphoid organs and the ligand for CCR7 (A); CXCL12, the ligand for CXCR4 mostly involved in T-cell zone entry (B); and CXCL13, a chemokine made in B-cell zones of lymphoid organs and the ligand for CXCR5 (C).Citation22,23 The chemokine expression pattern of CD40B cells (D) allows them to migrate toward the B/T cell boundary (E).
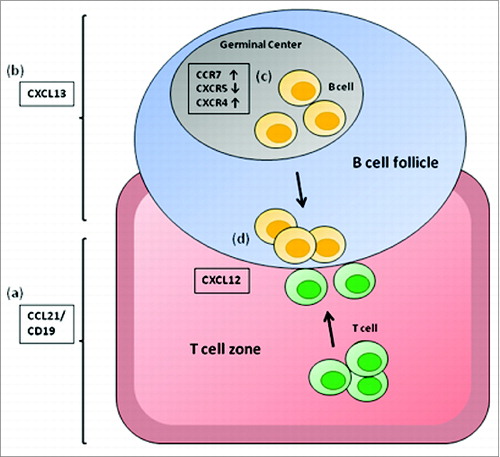
Figure 4. B cell migrate toward homing chemokines and attract T cells in vitro. (A) Unstimulated CD19+ B cells (gray columns) and CD40B cells (black columns) were tested for migration toward CCL21, CXCL12, and CXCL13. CD40B medium alone was used to record spontaneous migration (NC). Cells were allowed to migrate for 3 h through a 5 μm filter transwell assay. (B) Purified CD4+ T cells were allowed to migrate for 2 h through a 5 μm filter to the lower chamber of transwell plates containing supernatant from murine CD40B cells, the chemokine CXCL12 (SDF1a) or CD40B medium alone (NC). Mean values ± SD from 3 experiments are shown. * p < 0.05, ** p < 0.01.
Figure 5. CD40B cells migrate to spleens and lymph nodes in healthy and tumor-bearing mice. 5–10 × 106 CD40B cells from luciferase+ mice (A and C) or GFP+ mice (B) were injected into C57BL/6 mice subcutaneously (s.c.) or intravenously (i.v.). 12 hours (12 h), 36 hours (36 h) or 5 days (5 d) after injection, mice were analyzed for the presence of the CD40B cells either by imaging in the IVIS 200 system in healthy mice (A) or EL4 tumor-bearing mice (C). Cy3 stained to detect all B220+ B cells (red); GFP+ CD40B cells (green) by confocal microscopy (B, upper panel). Representative pictures out of 3 experiments are shown. The number of GFP+ CD40B cells was determined at the indicated time points (B, lower panel). Mean values from one representative experiment are shown; n = 2 mice per time point and condition from each independent experiment.
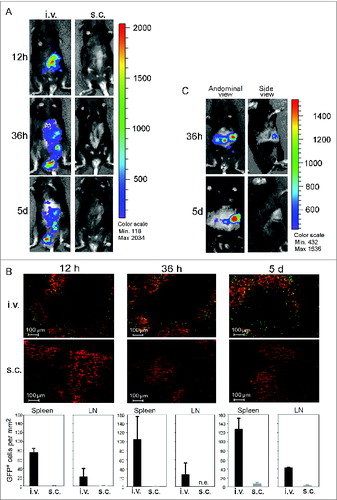
Figure 6. CD40B induce specific lysis of target cells. C57BL/6N mice were immunized with 5 × 10⁶ APCs, i.e., CD40B cells (CD40Bs) or B cells, PBS+IFA as negative controls (NC), or incomplete Freund's adjuvant + PBS + OVA-Protein + CpG as positive controls (PC) three times i.v. in an interval of 7 d The ratio of CFSE+ target cells in spleens was determined by FACS and the specific lysis was calculated by normalizing values to negative controls. Bar charts show mean values ± SD of specific lysis of one independent experiments with three mice per group. Significant differences calculated with ordinary one-way ANOVA are marked by an asterisk. * p ≤ 0.05.