869
Views
22
CrossRef citations to date
0
Altmetric
Original Research

Particulate β-glucan regulates the immunosuppression of granulocytic myeloid-derived suppressor cells by inhibiting NFIA expression

, , , , , , , , & show all
Article: e1038687 | Received 17 Feb 2015, Accepted 02 Apr 2015, Published online: 27 Jul 2015

Figures & data

Figure 1. WGP downregulates expression of NFIA in G-MDSCs via Dectin-1 pathway in vitro. A total of 3 × 10⁶ Lewis lung carcinoma cells (LLCs) were injected s.c. into C57BL/6 mice. After 4 weeks, splenocytes were collected and G-MDSCs were sorted. (A) Total RNA isolated from G-MDSCs was subjected to qRT-PCR to measure NFIA expression. (B, C) Sorted G-MDSCs were cultured in the presence or absence of WGP (100 μg/mL) for 24 h/48 h. (B) NFIA mRNA level in G-MDSCs was measured by qRT-PCR. (C) Protein gel blot analysis was developed with anti-NFIA antibody. Histone 3 served as a loading control. The amount of NFIA protein was calculated by gray scanning. (D, E) The purified G-MDSCs were pretreated with anti-Dectin-1 mAb or isotype rat IgG (5 μg/mL) for 1h at 37°C and then treated with 100 μg/mL WGP. After 24 h/48 h stimulation, cells were collected. (D) RNA isolated from collected G-MDSCs was subjected to qRT-PCR to measure NFIA mRNA expression. (E) NFIA protein in G-MDSCs was detected by protein gel blot. The amount of NFIA protein was calculated by gray scanning. ***p < 0.001, *p < 0.05, ns: no significance.
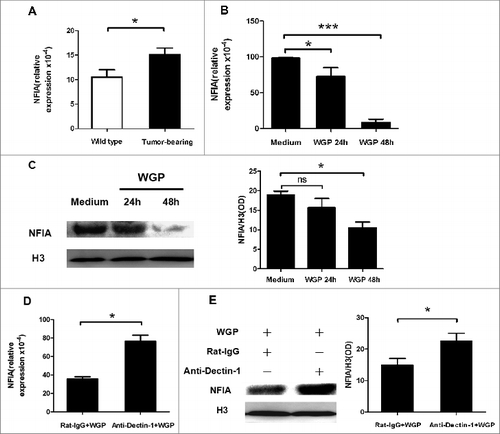
Figure 1. WGP downregulates expression of NFIA in G-MDSCs via Dectin-1 pathway in vitro. A total of 3 × 10⁶ Lewis lung carcinoma cells (LLCs) were injected s.c. into C57BL/6 mice. After 4 weeks, splenocytes were collected and G-MDSCs were sorted. (A) Total RNA isolated from G-MDSCs was subjected to qRT-PCR to measure NFIA expression. (B, C) Sorted G-MDSCs were cultured in the presence or absence of WGP (100 μg/mL) for 24 h/48 h. (B) NFIA mRNA level in G-MDSCs was measured by qRT-PCR. (C) Protein gel blot analysis was developed with anti-NFIA antibody. Histone 3 served as a loading control. The amount of NFIA protein was calculated by gray scanning. (D, E) The purified G-MDSCs were pretreated with anti-Dectin-1 mAb or isotype rat IgG (5 μg/mL) for 1h at 37°C and then treated with 100 μg/mL WGP. After 24 h/48 h stimulation, cells were collected. (D) RNA isolated from collected G-MDSCs was subjected to qRT-PCR to measure NFIA mRNA expression. (E) NFIA protein in G-MDSCs was detected by protein gel blot. The amount of NFIA protein was calculated by gray scanning. ***p < 0.001, *p < 0.05, ns: no significance.

Figure 2. The attenuated expression of NFIA in G-MDSCs induced by WGP is c-jun molecule dependent. (A) G-MDSCs sorted from splenocytes of tumor-bearing mice were treated with or without WGP (100 μg/mL) for indicated times. Protein gel blot analysis developed with anti-phospho-c-jun antibody and anti-c-jun antibody, histone 3 served as a loading control. The amount of phospho-c-jun protein was calculated by gray scanning. (B, C) G-MDSCs sorted from splenocytes of tumor-bearing mice were pretreated with SP600125 (20 μmol/mL) which is the inhibitor of the phosphorylation of c-jun or DMSO at 37°Cfor 1 h and then stimulated with 100 μg/mL WGP. After 24 h/48 h stimulation, cells were collected. (B) The NFIA mRNA expression in collected G-MDSCs was detected by qRT-PCR. (C) Protein gel blot detection of NFIA protein in G-MDSCs. The amount of NFIA protein was calculated by gray scanning. **p < 0.01, *p < 0.05.
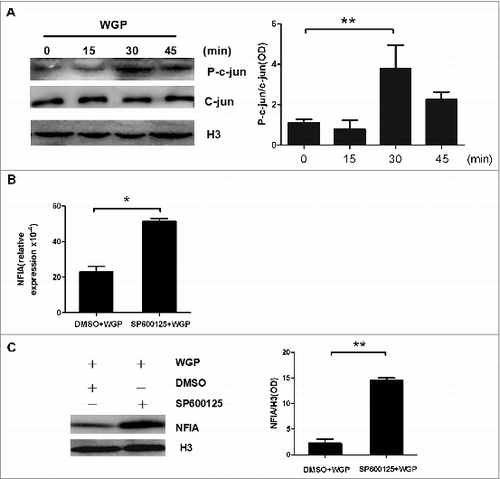
Figure 2. The attenuated expression of NFIA in G-MDSCs induced by WGP is c-jun molecule dependent. (A) G-MDSCs sorted from splenocytes of tumor-bearing mice were treated with or without WGP (100 μg/mL) for indicated times. Protein gel blot analysis developed with anti-phospho-c-jun antibody and anti-c-jun antibody, histone 3 served as a loading control. The amount of phospho-c-jun protein was calculated by gray scanning. (B, C) G-MDSCs sorted from splenocytes of tumor-bearing mice were pretreated with SP600125 (20 μmol/mL) which is the inhibitor of the phosphorylation of c-jun or DMSO at 37°Cfor 1 h and then stimulated with 100 μg/mL WGP. After 24 h/48 h stimulation, cells were collected. (B) The NFIA mRNA expression in collected G-MDSCs was detected by qRT-PCR. (C) Protein gel blot detection of NFIA protein in G-MDSCs. The amount of NFIA protein was calculated by gray scanning. **p < 0.01, *p < 0.05.

Figure 3. NFIA knockdown alters the suppressive capacity of G-MDSCs in vitro. G-MDSCs sorted from splenocytes of tumor-bearing mice were transfected with NFIA siRNA (100 nM). (A) Protein gel blot analysis confirmed NFIA knockdown in G-MDSCs transfected with siNFIA. (B) G-MDSCs transfected with NFIA siRNA, then cells were harvested and cocultured with CD4+ T cells at different ratios in the presence of anti-CD3 mAb and anti-CD28 mAb for 72 h. 3H-thymidine incorporation was used to detect T cells proliferation. (C) NADPH oxidase complex which consists of phox p47 and gp91 appears to be a major source of ROS. Here, p47 and gp91 were chosen to represent the ROS production. Arg1 and gp91/p47 mRNA levels in G-MDSCs transfected with siNFIA were detected by qRT-PCR. (D) Arg1 activity of G-MDSCs transfected with siNFIA was measured. Production of ROS in G-MDSCs was analyzed by flow cytometry. ***p < 0.001, **p < 0.01, *p < 0.05, ns: no significance, Geo MFI: geometric mean fluorescent intensity.
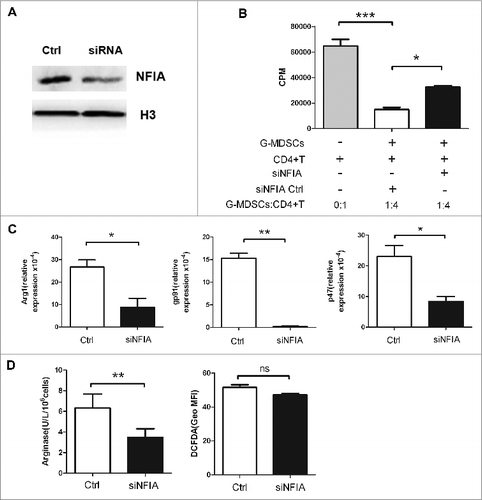
Figure 3. NFIA knockdown alters the suppressive capacity of G-MDSCs in vitro. G-MDSCs sorted from splenocytes of tumor-bearing mice were transfected with NFIA siRNA (100 nM). (A) Protein gel blot analysis confirmed NFIA knockdown in G-MDSCs transfected with siNFIA. (B) G-MDSCs transfected with NFIA siRNA, then cells were harvested and cocultured with CD4+ T cells at different ratios in the presence of anti-CD3 mAb and anti-CD28 mAb for 72 h. 3H-thymidine incorporation was used to detect T cells proliferation. (C) NADPH oxidase complex which consists of phox p47 and gp91 appears to be a major source of ROS. Here, p47 and gp91 were chosen to represent the ROS production. Arg1 and gp91/p47 mRNA levels in G-MDSCs transfected with siNFIA were detected by qRT-PCR. (D) Arg1 activity of G-MDSCs transfected with siNFIA was measured. Production of ROS in G-MDSCs was analyzed by flow cytometry. ***p < 0.001, **p < 0.01, *p < 0.05, ns: no significance, Geo MFI: geometric mean fluorescent intensity.

Figure 4. NFIA knockdown declines the capability of G-MDSCs to accelerate the tumor progression and inhibit the antitumor immune responses. Groups of mice were injected s.c. with the cells mix of G-MDSCs transfected with siNFIA and LLCs. (A) Tumor volume and weight were measured at indicated time. (B) Survival of mice in different groups. (C) The proportions of CD4+IFNγ+ Th1 and CD8+IFNγ+ CTL cells from spleens, draining lymph nodes and tumor tissue were analyzed by flow cytometry. ***p < 0.001, **p < 0.01, *p < 0.05.
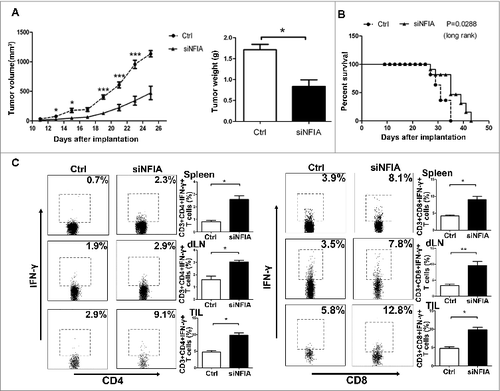
Figure 4. NFIA knockdown declines the capability of G-MDSCs to accelerate the tumor progression and inhibit the antitumor immune responses. Groups of mice were injected s.c. with the cells mix of G-MDSCs transfected with siNFIA and LLCs. (A) Tumor volume and weight were measured at indicated time. (B) Survival of mice in different groups. (C) The proportions of CD4+IFNγ+ Th1 and CD8+IFNγ+ CTL cells from spleens, draining lymph nodes and tumor tissue were analyzed by flow cytometry. ***p < 0.001, **p < 0.01, *p < 0.05.

Figure 5. Administration of siNFIA into tumor tissue delays tumor progression and enhances antitumor immune responses. Groups of mice bearing established LLC were intratumorally injected with siNFIA every 3 d for 2 weeks. (A) The proportion of CD11b+Ly6G+ G-MDSCs in tumor tissue was analyzed by flow cytometry. (B) G-MDSCs from tumor tissue were isolated, NFIA protein level was detected by Protein gel blot. Arg1 activity and ROS production in G-MDSCs sorted from tumor tissues were detected. (C) Tumor volume and weight were measured at indicated time. (D) Survival of mice in different groups. (E) Ki67 expression in tumor tissue was detected by qRT-PCR. (F) The proportions of CD4+IFNγ+ Th1 and CD8+IFNγ+ CTL cells from spleens, draining lymph nodes and tumor tissue were analyzed by flow cytometry. **p < 0.01, *p < 0.05, ns: no significance, Geo MFI: geometric mean fluorescent intensity.
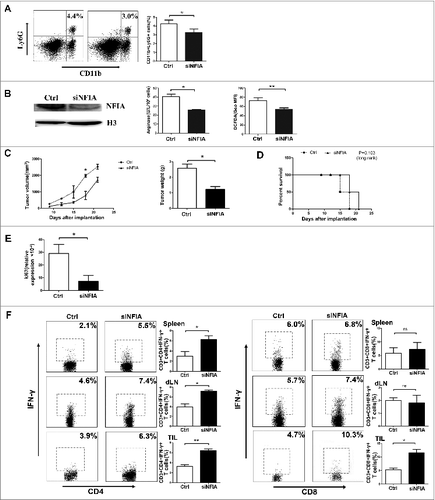
Figure 5. Administration of siNFIA into tumor tissue delays tumor progression and enhances antitumor immune responses. Groups of mice bearing established LLC were intratumorally injected with siNFIA every 3 d for 2 weeks. (A) The proportion of CD11b+Ly6G+ G-MDSCs in tumor tissue was analyzed by flow cytometry. (B) G-MDSCs from tumor tissue were isolated, NFIA protein level was detected by Protein gel blot. Arg1 activity and ROS production in G-MDSCs sorted from tumor tissues were detected. (C) Tumor volume and weight were measured at indicated time. (D) Survival of mice in different groups. (E) Ki67 expression in tumor tissue was detected by qRT-PCR. (F) The proportions of CD4+IFNγ+ Th1 and CD8+IFNγ+ CTL cells from spleens, draining lymph nodes and tumor tissue were analyzed by flow cytometry. **p < 0.01, *p < 0.05, ns: no significance, Geo MFI: geometric mean fluorescent intensity.

Figure 6. High level of NFIA in human lung cancer tissue. NFIA expression (A) and Arg1 expression (B) of tumor and adjacent tissues from lung cancer patients were detected by qRT-PCR. (C) Correlation of the expression of NFIA and Arg1 in tumor tissue from lung cancer patients. **p < 0.01, *p < 0.05.
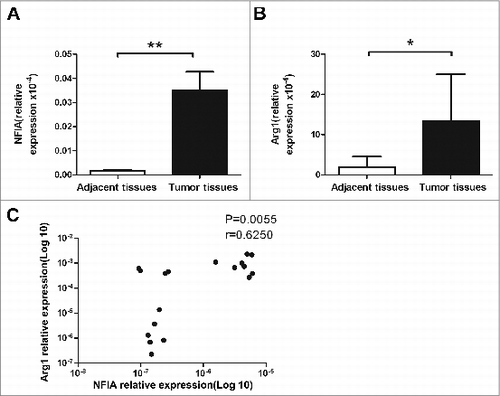
Figure 6. High level of NFIA in human lung cancer tissue. NFIA expression (A) and Arg1 expression (B) of tumor and adjacent tissues from lung cancer patients were detected by qRT-PCR. (C) Correlation of the expression of NFIA and Arg1 in tumor tissue from lung cancer patients. **p < 0.01, *p < 0.05.
Supplemental material

1038687_Supplemental_data.pdf

Download PDF (236.9 KB)

Reprints and Corporate Permissions

Please note: Selecting permissions does not provide access to the full text of the article, please see our help page How do I view content?

To request a reprint or corporate permissions for this article, please click on the relevant link below:

Academic Permissions

Please note: Selecting permissions does not provide access to the full text of the article, please see our help page How do I view content?

Obtain permissions instantly via Rightslink by clicking on the button below:

If you are unable to obtain permissions via Rightslink, please complete and submit this Permissions form. For more information, please visit our Permissions help page.