6,034
Views
129
CrossRef citations to date
0
Altmetric
Original Research

Hydrogel dual delivered celecoxib and anti-PD-1 synergistically improve antitumor immunity

, , , , , , , , , , & show all
Article: e1074374 | Received 13 Apr 2015, Accepted 15 Jul 2015, Published online: 26 Feb 2016

Figures & data

Figure 1. Alginate hydrogel delivery enhances the antitumor efficacy of celecoxib (CXB) and anti-PD-1 mAb (αPD-1). C57BL/6 mice received the different treatments at Day 7 after the inoculation of 1.0 × 10⁵ B16-F10 cells. (A and B) Quantification of the tumor sizes (left) and the survival percentage (right) of the animals treated with the hydrogels encapsulated with the indicated dosages of CXB (A) or αPD-1 (B). (C) Quantification of the tumor sizes (left) and the survival percentage (right) of the animals receiving CXB (25mg/kg) delivered in three ways: one-time subcutaneous injection of the CXB-encapsulated hydrogel (gel), one-time subcutaneous injection of PBS-dissolved CXB (PBS), and daily intragastrical administration (i.g. daily). (D) Quantification of the tumor sizes (left) and the survival percentage (right) of the animals receiving αPD-1 (100µg per animal) in three ways: one-time subcutaneous injection of the αPD-1-encapsulated hydrogel (gel), one-time subcutaneous injection of PBS-dissolved αPD-1 (PBS), and one-time αPD-1 intraperitoneal injection (i.p.). n = 5 animals per group in A–D. (E) The CXB serum concentrations (left) and CXB amount within the tumors (right) in the animals treated with CXB (25mg/kg) delivered via gel or PBS. (F) αPD-1 concentrations in serum (left) and within the tumors (right) in the animals treated with 100µg αPD-1 given in three ways described in (D). n = 3 animals per time point. *P < 0.05, Student's t-tests. Error bars represent the standard error of the mean.
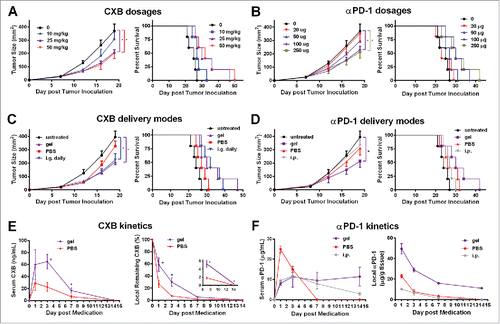
Figure 1. Alginate hydrogel delivery enhances the antitumor efficacy of celecoxib (CXB) and anti-PD-1 mAb (αPD-1). C57BL/6 mice received the different treatments at Day 7 after the inoculation of 1.0 × 10⁵ B16-F10 cells. (A and B) Quantification of the tumor sizes (left) and the survival percentage (right) of the animals treated with the hydrogels encapsulated with the indicated dosages of CXB (A) or αPD-1 (B). (C) Quantification of the tumor sizes (left) and the survival percentage (right) of the animals receiving CXB (25mg/kg) delivered in three ways: one-time subcutaneous injection of the CXB-encapsulated hydrogel (gel), one-time subcutaneous injection of PBS-dissolved CXB (PBS), and daily intragastrical administration (i.g. daily). (D) Quantification of the tumor sizes (left) and the survival percentage (right) of the animals receiving αPD-1 (100µg per animal) in three ways: one-time subcutaneous injection of the αPD-1-encapsulated hydrogel (gel), one-time subcutaneous injection of PBS-dissolved αPD-1 (PBS), and one-time αPD-1 intraperitoneal injection (i.p.). n = 5 animals per group in A–D. (E) The CXB serum concentrations (left) and CXB amount within the tumors (right) in the animals treated with CXB (25mg/kg) delivered via gel or PBS. (F) αPD-1 concentrations in serum (left) and within the tumors (right) in the animals treated with 100µg αPD-1 given in three ways described in (D). n = 3 animals per time point. *P < 0.05, Student's t-tests. Error bars represent the standard error of the mean.

Figure 2. Simultaneous delivery of celecoxib and anti-PD-1 mAb augments their individual inhibitory effects on tumor growth and metastasis. (A and B) C57BL/6 mice received the different treatments at Day 7 after the inoculation of 2.5 × 10⁴ B16-F10 cells. Quantification of the tumor sizes (A) and the survival percentage (B) over time in the animals receiving the non-hydrogel combined therapy of CXB and anti-PD-1 mAb (CXB + αPD-1), the blank hydrogel treatment (gel), and the treatments with the hydrogels delivering CXB (+ CXB), anti-PD-1 mAb (+ αPD-1), or both (+ CXB + αPD-1). n = 9–12 animals per group. Four independent experiments were performed. (C–F) BALB/c mice received the different treatments at Day 7 after the inoculation of 1.0 × 10⁶ 4T1 cells. The representative images (C) and quantification (D) of the pulmonary metastatic nodules isolated at Day 32 after tumor cell inoculation from the 4T-1-breast-cancer bearing mice receiving the indicated treatments as in (A) and (B) at Day 7 after tumor inoculation. The primary tumor sizes (E) and the survival percentage (F) in the corresponding treatment groups described in (C). n = 4–6 animals per group. Three independent experiments were performed. *P < 0.05, **P < 0.01, N.S., not significant, Student's t-tests. The asterisk without a line underneath indicates the comparison to the blank hydrogel group. Error bars represent the standard error of the mean.
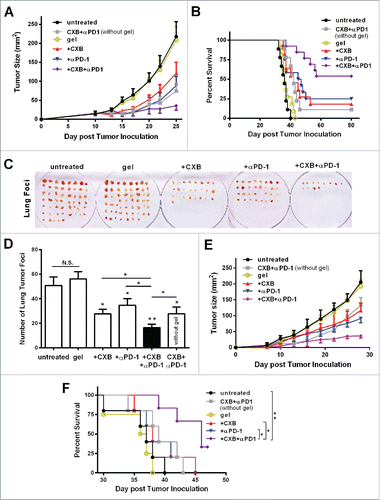
Figure 2. Simultaneous delivery of celecoxib and anti-PD-1 mAb augments their individual inhibitory effects on tumor growth and metastasis. (A and B) C57BL/6 mice received the different treatments at Day 7 after the inoculation of 2.5 × 10⁴ B16-F10 cells. Quantification of the tumor sizes (A) and the survival percentage (B) over time in the animals receiving the non-hydrogel combined therapy of CXB and anti-PD-1 mAb (CXB + αPD-1), the blank hydrogel treatment (gel), and the treatments with the hydrogels delivering CXB (+ CXB), anti-PD-1 mAb (+ αPD-1), or both (+ CXB + αPD-1). n = 9–12 animals per group. Four independent experiments were performed. (C–F) BALB/c mice received the different treatments at Day 7 after the inoculation of 1.0 × 10⁶ 4T1 cells. The representative images (C) and quantification (D) of the pulmonary metastatic nodules isolated at Day 32 after tumor cell inoculation from the 4T-1-breast-cancer bearing mice receiving the indicated treatments as in (A) and (B) at Day 7 after tumor inoculation. The primary tumor sizes (E) and the survival percentage (F) in the corresponding treatment groups described in (C). n = 4–6 animals per group. Three independent experiments were performed. *P < 0.05, **P < 0.01, N.S., not significant, Student's t-tests. The asterisk without a line underneath indicates the comparison to the blank hydrogel group. Error bars represent the standard error of the mean.
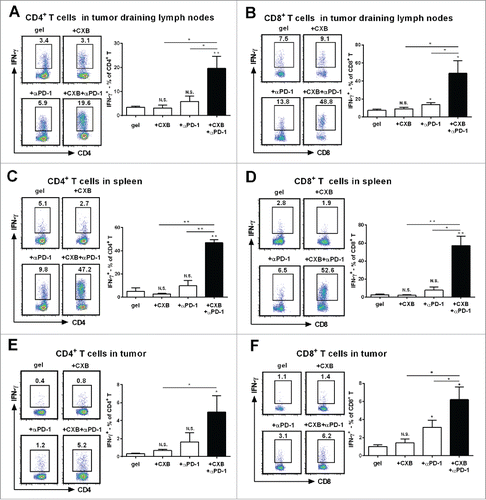
Figure 3. Synergistic effects of dually delivered celecoxib (CXB) and anti-PD-1 mAb (αPD-1) on increasing the presence of INFγ-expressing CD4 and CD8 T cells. C57BL/6 mice received the treatments with the blank hydrogel (gel) and the hydrogels delivering CXB (+ CXB), anti-PD-1 mAb (+ αPD-1), or both (+ CXB + αPD-1) at Day 7 after the inoculation of 1.0 × 10⁵ B16-F10 cells. (A and B) The representative flow cytometric analysis images (left) and the corresponding quantification (right) of IFN-γ positive CD4+ T cells (A) and CD8+ T cells (B) from the tumor draining lymph nodes of the mice 7 days after the treatments. (C and D) The similar T cell analyses for spleens. (E and F) The similar T cell analyses for tumor tissues. Each column represents 3 independent experiments (n = 6–8 mice per group per experiment). *P < 0.05, **P < 0.01, N.S., not significant, Student's t-tests. The asterisk or “N.S.” without a line underneath indicates the comparison to the blank hydrogel group. Error bars represent the standard error of the mean.
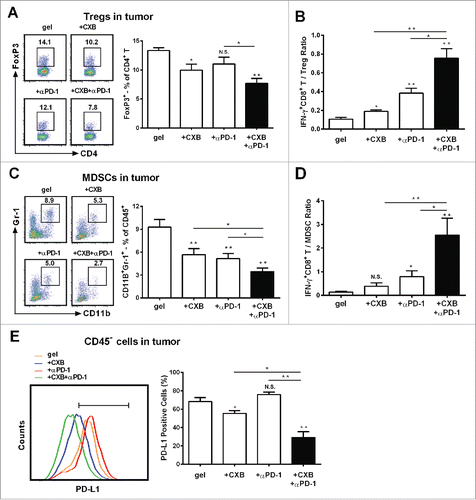
Figure 3. Synergistic effects of dually delivered celecoxib (CXB) and anti-PD-1 mAb (αPD-1) on increasing the presence of INFγ-expressing CD4 and CD8 T cells. C57BL/6 mice received the treatments with the blank hydrogel (gel) and the hydrogels delivering CXB (+ CXB), anti-PD-1 mAb (+ αPD-1), or both (+ CXB + αPD-1) at Day 7 after the inoculation of 1.0 × 10⁵ B16-F10 cells. (A and B) The representative flow cytometric analysis images (left) and the corresponding quantification (right) of IFN-γ positive CD4+ T cells (A) and CD8+ T cells (B) from the tumor draining lymph nodes of the mice 7 days after the treatments. (C and D) The similar T cell analyses for spleens. (E and F) The similar T cell analyses for tumor tissues. Each column represents 3 independent experiments (n = 6–8 mice per group per experiment). *P < 0.05, **P < 0.01, N.S., not significant, Student's t-tests. The asterisk or “N.S.” without a line underneath indicates the comparison to the blank hydrogel group. Error bars represent the standard error of the mean.
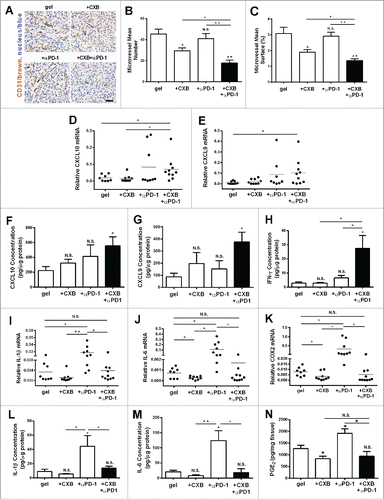
Figure 4. The enhanced effects of celecoxib (CXB) and anti-PD-1 mAb (αPD-1) on decreasing the presence of intratumoral Tregs, MDSCs, and PD-L1 positive tumor cells. C57BL/6 mice received the treatments with the blank hydrogel (gel) and the hydrogels delivering CXB (+ CXB), anti-PD-1 mAb (+ αPD-1), or both (+ CXB + αPD-1) at Day 7 after the inoculation of 1.0 × 10⁵ B16-F10 cells. Single-cell suspensions made from digested tumor tissues were subject to flow cytometric analyses 7 days after the treatments. (A) The representatives flow cytometric analysis images (left) and the corresponding quantification (right) of FoxP3+ analyses of CD4+ T cells. (B) The ratios of IFNγ+CD8+ T cells to Tregs. Each column represents three independent experiments (n = 6–8 animals per group per experiment). (C) The representative flow cytometric analysis images (left) and the corresponding quantification (right) of MDSCs (CD11b+Gr-1+) in CD45+ cells. (D) The ratios of IFN-γ+CD8+ T cells to MDSCs. (E) The representative flow cytometric analysis images (left) and the corresponding quantification (right) of PD-L1 analyses within the CD45 cells. Each column represents three independent experiments (n = 8–12 animals per group per experiment). *P < 0.05, **P < 0.01, N.S., not significant, Student's t-tests. The asterisk or “N.S.” without a line underneath indicates the comparison to the blank hydrogel group. Error bars represent the standard error of the mean.

Figure 4. The enhanced effects of celecoxib (CXB) and anti-PD-1 mAb (αPD-1) on decreasing the presence of intratumoral Tregs, MDSCs, and PD-L1 positive tumor cells. C57BL/6 mice received the treatments with the blank hydrogel (gel) and the hydrogels delivering CXB (+ CXB), anti-PD-1 mAb (+ αPD-1), or both (+ CXB + αPD-1) at Day 7 after the inoculation of 1.0 × 10⁵ B16-F10 cells. Single-cell suspensions made from digested tumor tissues were subject to flow cytometric analyses 7 days after the treatments. (A) The representatives flow cytometric analysis images (left) and the corresponding quantification (right) of FoxP3+ analyses of CD4+ T cells. (B) The ratios of IFNγ+CD8+ T cells to Tregs. Each column represents three independent experiments (n = 6–8 animals per group per experiment). (C) The representative flow cytometric analysis images (left) and the corresponding quantification (right) of MDSCs (CD11b+Gr-1+) in CD45+ cells. (D) The ratios of IFN-γ+CD8+ T cells to MDSCs. (E) The representative flow cytometric analysis images (left) and the corresponding quantification (right) of PD-L1 analyses within the CD45− cells. Each column represents three independent experiments (n = 8–12 animals per group per experiment). *P < 0.05, **P < 0.01, N.S., not significant, Student's t-tests. The asterisk or “N.S.” without a line underneath indicates the comparison to the blank hydrogel group. Error bars represent the standard error of the mean.

Figure 5. The inhibition on angiogenesis and inflammation in the tumors resulting from the dual delivery of celecoxib (CXB) and anti-PD-1 mAb (αPD-1). C57BL/6 mice received the treatments with the blank hydrogel (gel) and the hydrogels delivering CXB (+ CXB), anti-PD-1 mAb (+ αPD-1), or both (+ CXB + αPD-1) at Day 7 after the inoculation of 1.0 × 10⁵ B16-F10 cells. The tumors were surgically taken from the mice 7 d after the treatments. (A) The representative images of blood vessel CD31 immunohistochemical staining for the tumors. (B) Quantification of the number of microvessels. (C) Quantification of the microvessel surface percentage. (D–N) The relative mRNA levels of CXCL10 (D), CXCL9 (E), IL-1β (I), IL-6 (J), COX2 (K), the protein levels of CXCL10 (F), CXCL9 (G), IFN-γ (H), IL-1β (L) and IL-6 (M) and PGE2 concentrations (N) within the tumors in the corresponding treatment groups. *P < 0.05, **P < 0.01, N.S., not significant, Student's t-tests. The asterisk or “N.S.” without a line underneath indicates the comparison to the blank hydrogel group. Error bars represent the standard error of the mean.

Figure 5. The inhibition on angiogenesis and inflammation in the tumors resulting from the dual delivery of celecoxib (CXB) and anti-PD-1 mAb (αPD-1). C57BL/6 mice received the treatments with the blank hydrogel (gel) and the hydrogels delivering CXB (+ CXB), anti-PD-1 mAb (+ αPD-1), or both (+ CXB + αPD-1) at Day 7 after the inoculation of 1.0 × 10⁵ B16-F10 cells. The tumors were surgically taken from the mice 7 d after the treatments. (A) The representative images of blood vessel CD31 immunohistochemical staining for the tumors. (B) Quantification of the number of microvessels. (C) Quantification of the microvessel surface percentage. (D–N) The relative mRNA levels of CXCL10 (D), CXCL9 (E), IL-1β (I), IL-6 (J), COX2 (K), the protein levels of CXCL10 (F), CXCL9 (G), IFN-γ (H), IL-1β (L) and IL-6 (M) and PGE2 concentrations (N) within the tumors in the corresponding treatment groups. *P < 0.05, **P < 0.01, N.S., not significant, Student's t-tests. The asterisk or “N.S.” without a line underneath indicates the comparison to the blank hydrogel group. Error bars represent the standard error of the mean.
Supplemental material

1074374_supplemental_files.zip

Download Zip (301 KB)

Reprints and Corporate Permissions

Please note: Selecting permissions does not provide access to the full text of the article, please see our help page How do I view content?

To request a reprint or corporate permissions for this article, please click on the relevant link below:

Academic Permissions

Please note: Selecting permissions does not provide access to the full text of the article, please see our help page How do I view content?

Obtain permissions instantly via Rightslink by clicking on the button below:

If you are unable to obtain permissions via Rightslink, please complete and submit this Permissions form. For more information, please visit our Permissions help page.