1,792
Views
33
CrossRef citations to date
0
Altmetric
Original Research

Drug-induced hyperploidy stimulates an antitumor NK cell response mediated by NKG2D and DNAM-1 receptors

, , , , , & show all
Article: e1074378 | Received 14 Jul 2015, Accepted 15 Jul 2015, Published online: 26 Feb 2016

Figures & data

Figure 1. Analysis of DNA content and CRT expression in tumor cells treated with drugs that induce hyperploidy. (A) Representative cell cycle profiles of K-562, HCT-116 and Hep-G2 cells treated with cytochalasin D (0.6 µg/mL), nocodazole (100 nM) or docetaxel (3 nM) for 48 h are reported. Numbers refer to percentage of polyploid (>4n) cells. (B) Cancer cells were treated with cytochalasin D, nocodazole or docetaxel for 48 h and the cell surface expression of CRT was analyzed by flow cytometry. The histograms show a representative experiment performed with HCT116 cells. (C) The graph shows the fold induction ± SEM of the mean fluorescent intensity (MFI) of CRT on the cell surface of K-562, HCT-116 and Hep-G2 cells (at least three independent experiments were performed; *p < 0.05; **p < 0.01, Mann–Whitney U test).
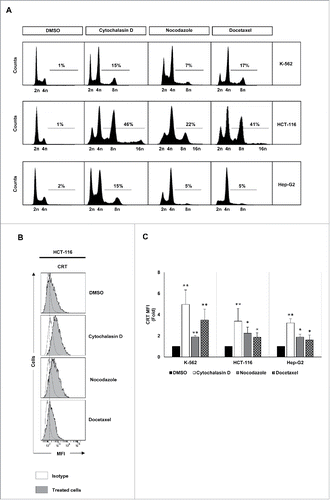
Figure 1. Analysis of DNA content and CRT expression in tumor cells treated with drugs that induce hyperploidy. (A) Representative cell cycle profiles of K-562, HCT-116 and Hep-G2 cells treated with cytochalasin D (0.6 µg/mL), nocodazole (100 nM) or docetaxel (3 nM) for 48 h are reported. Numbers refer to percentage of polyploid (>4n) cells. (B) Cancer cells were treated with cytochalasin D, nocodazole or docetaxel for 48 h and the cell surface expression of CRT was analyzed by flow cytometry. The histograms show a representative experiment performed with HCT116 cells. (C) The graph shows the fold induction ± SEM of the mean fluorescent intensity (MFI) of CRT on the cell surface of K-562, HCT-116 and Hep-G2 cells (at least three independent experiments were performed; *p < 0.05; **p < 0.01, Mann–Whitney U test).

Figure 2. NKG2D ligand expression increases in cancer cells upon treatment with drugs that induce hyperploidy. (A) Cancer cells were treated with the hyperploidy-induced drugs, nocodazole or docetaxel for 48 h and the membrane expression of MICA, ULBP1, ULBP2 and ULBP3 was evaluated by flow cytometry. The histograms of one representative experiment with K-562 cells are shown. Isotypes for each condition are shown as empty histograms and treated cells are represented as gray histograms. (B–E) K-562, HCT-116 and Hep-G2 cells were treated as detailed in (A) and NKG2D ligand surface expression was monitored by flow cytometry. The bars represent the mean of the fold induction ± SEM of the MFI of the treated cells relative to the vehicle-treated control (at least three independent experiments were performed; *p < 0.05; **p < 0.01).
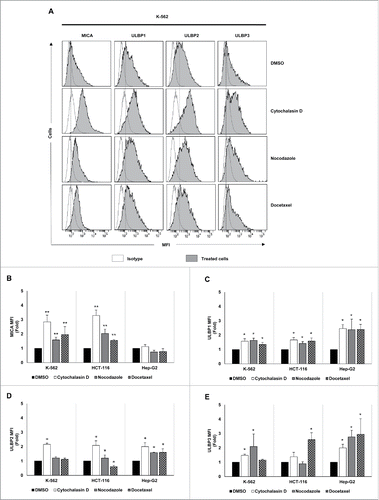
Figure 2. NKG2D ligand expression increases in cancer cells upon treatment with drugs that induce hyperploidy. (A) Cancer cells were treated with the hyperploidy-induced drugs, nocodazole or docetaxel for 48 h and the membrane expression of MICA, ULBP1, ULBP2 and ULBP3 was evaluated by flow cytometry. The histograms of one representative experiment with K-562 cells are shown. Isotypes for each condition are shown as empty histograms and treated cells are represented as gray histograms. (B–E) K-562, HCT-116 and Hep-G2 cells were treated as detailed in (A) and NKG2D ligand surface expression was monitored by flow cytometry. The bars represent the mean of the fold induction ± SEM of the MFI of the treated cells relative to the vehicle-treated control (at least three independent experiments were performed; *p < 0.05; **p < 0.01).
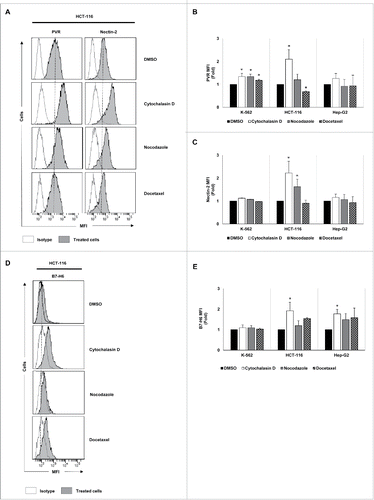
Figure 3. Analysis of the tumor expression of DNAM-1 and NKp30 ligands upon treatment with drugs that induce cell hyperploidy. K-562, HCT-116 and Hep-G2 cells were treated with cytochalasin D, nocodazole or docetaxel for 48 h, and the membrane expression of PVR (A and B), Nectin-2 (A and C) and B7-H6 (D and E) was analyzed by flow cytometry. (A and D) A representative experiment performed in HCT-116 cells is included. Isotypes for each condition are shown as empty histograms and treated cells are shown as gray histograms. (B, C and E) The bars represent the mean of the fold induction ± SEM of the MFI of the treated cells relative to the vehicle-treated control (at least three independent experiments were performed; *p < 0.05; **p < 0.01).

Figure 3. Analysis of the tumor expression of DNAM-1 and NKp30 ligands upon treatment with drugs that induce cell hyperploidy. K-562, HCT-116 and Hep-G2 cells were treated with cytochalasin D, nocodazole or docetaxel for 48 h, and the membrane expression of PVR (A and B), Nectin-2 (A and C) and B7-H6 (D and E) was analyzed by flow cytometry. (A and D) A representative experiment performed in HCT-116 cells is included. Isotypes for each condition are shown as empty histograms and treated cells are shown as gray histograms. (B, C and E) The bars represent the mean of the fold induction ± SEM of the MFI of the treated cells relative to the vehicle-treated control (at least three independent experiments were performed; *p < 0.05; **p < 0.01).

Figure 4. NK cell activating ligands are upregulated in polyploid cancer cells. Cancer cells were treated with cytochalasin D and DNA content and membrane expression of MICA, ULBP2, PVR and Nectin-2 were simultaneously assessed by flow cytometry upon Hoechst 33342 staining. (A and C) The histograms of one representative experiment performed with HCT-116 cells are shown. (B and D) The bars represent the MFI ± SEM of MICA and ULBP2 (B) and PVR and Nectin-2 (D) expression detected for each DNA content (2n vs. >4n) of cancer cells treated or not with cytochalasin D (at least three independent experiments were performed; *p < 0.05).
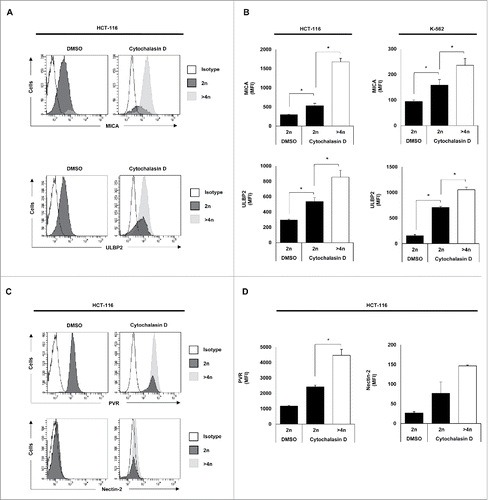
Figure 4. NK cell activating ligands are upregulated in polyploid cancer cells. Cancer cells were treated with cytochalasin D and DNA content and membrane expression of MICA, ULBP2, PVR and Nectin-2 were simultaneously assessed by flow cytometry upon Hoechst 33342 staining. (A and C) The histograms of one representative experiment performed with HCT-116 cells are shown. (B and D) The bars represent the MFI ± SEM of MICA and ULBP2 (B) and PVR and Nectin-2 (D) expression detected for each DNA content (2n vs. >4n) of cancer cells treated or not with cytochalasin D (at least three independent experiments were performed; *p < 0.05).

Figure 5. Exposure to drug-induced polyploid cancer cells stimulates the IFN-γ production and the cytotoxic activity of NK cells. (A) PBMCs from healthy donors (n = 4) were co-cultured with K-562 cells treated with cytochalasin D and the intracellular expression of IFN-γ was analyzed in NK, CD3+CD8+CD56+, CD8 T cells and CD4 T cells by flow cytometry. A representative histogram of IFN-γ producing NK cells under these conditions is shown. The graph shows the % of IFN-γ positive cells ± SEM (*p < 0.05). (B) Control and cytochalasin-induced hyperploid cancer cells were co-cultured with NK cells at an E:T ratio of 2:1, 10:1 and 20:1 for 4 h, and the cytotoxic activity of NK cells was evaluated by flow cytometry. Results are expressed as the percentage of specific lysis ± SEM (*p < 0.05). (C) Cytotoxic activity of NK cells against control and treated Hep-G2 cells in the presence of NKG2D and DNAM-1 blocking antibodies. Results are expressed as the percentage of specific lysis ± SEM of four independent experiments (*p < 0.05).
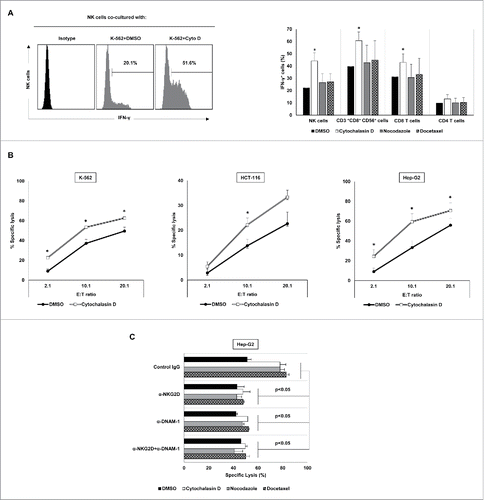
Figure 5. Exposure to drug-induced polyploid cancer cells stimulates the IFN-γ production and the cytotoxic activity of NK cells. (A) PBMCs from healthy donors (n = 4) were co-cultured with K-562 cells treated with cytochalasin D and the intracellular expression of IFN-γ was analyzed in NK, CD3+CD8+CD56+, CD8 T cells and CD4 T cells by flow cytometry. A representative histogram of IFN-γ producing NK cells under these conditions is shown. The graph shows the % of IFN-γ positive cells ± SEM (*p < 0.05). (B) Control and cytochalasin-induced hyperploid cancer cells were co-cultured with NK cells at an E:T ratio of 2:1, 10:1 and 20:1 for 4 h, and the cytotoxic activity of NK cells was evaluated by flow cytometry. Results are expressed as the percentage of specific lysis ± SEM (*p < 0.05). (C) Cytotoxic activity of NK cells against control and treated Hep-G2 cells in the presence of NKG2D and DNAM-1 blocking antibodies. Results are expressed as the percentage of specific lysis ± SEM of four independent experiments (*p < 0.05).

Figure 6. NK cell immune phenotype is modulated upon co-culture with drug-induced polyploid cancer cells. (A) NK cells isolated from healthy donors (n = 4) and expanded 5 days with IL-2 were co-cultured with control and drug-induced K-562 cells for 48 h and the expression of NKG2D, DNAM-1, NKp30, NKp44 and NKp46 receptors was analyzed on the surface of NK cells (CD3CD56+) by flow cytometry. The histograms of one representative donor co-cultured with hyperploid K-562 cells are shown. Untreated cells are shown as empty histograms and treated cells are shown as gray histograms. (B–F) The graphs show the fold induction ± SEM of the MFI of the molecules analyzed in treated cells relative to the vehicle-treated controls (*p < 0.05; **p < 0.01).
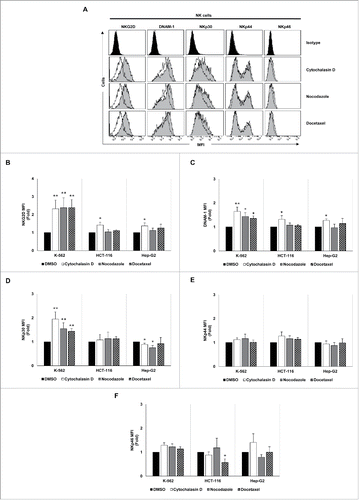
Figure 6. NK cell immune phenotype is modulated upon co-culture with drug-induced polyploid cancer cells. (A) NK cells isolated from healthy donors (n = 4) and expanded 5 days with IL-2 were co-cultured with control and drug-induced K-562 cells for 48 h and the expression of NKG2D, DNAM-1, NKp30, NKp44 and NKp46 receptors was analyzed on the surface of NK cells (CD3−CD56+) by flow cytometry. The histograms of one representative donor co-cultured with hyperploid K-562 cells are shown. Untreated cells are shown as empty histograms and treated cells are shown as gray histograms. (B–F) The graphs show the fold induction ± SEM of the MFI of the molecules analyzed in treated cells relative to the vehicle-treated controls (*p < 0.05; **p < 0.01).

Figure 7. Effect of exposure to drug-induced hyperploid cancer cells on the proliferation of immune cell subsets. (A) PBMCs (n = 6) (left histograms) or purified NK cells (n = 4) (right histograms) isolated from healthy donors were labeled with CFSE and co-cultured with hyperploid-K-562 cells for seven days. CFSE expression on NK cells, CD3+CD56+CD8+ T cells, CD8+ T cells and CD4+ T cells was examined by flow cytometry at day 0 and day 7. The histograms on the right represent the results obtained with purified NK cells. One representative experiment is shown. (B) The graph shows the mean of the fold induction ± SEM of the percentage of proliferative NK and CD3+ CD8+CD56+ cells relative to the negative control obtained in the experiments using PBMCs (*p < 0.05; **p < 0.01). (C) Results are expressed as the mean of the fold induction ± SEM of the percentage of proliferative NK cells relative to the vehicle-treated control obtained in the experiments using purified NK cells (n = 4; *p < 0.05; **p < 0.01).
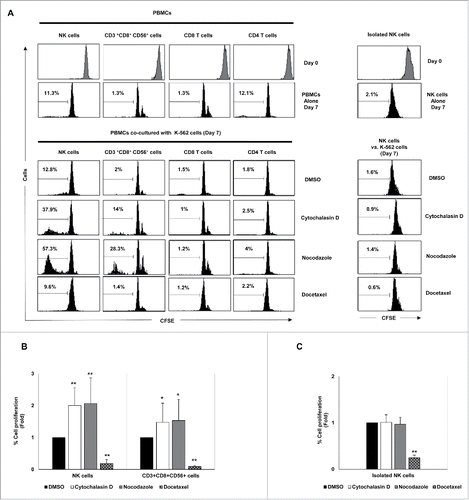
Figure 7. Effect of exposure to drug-induced hyperploid cancer cells on the proliferation of immune cell subsets. (A) PBMCs (n = 6) (left histograms) or purified NK cells (n = 4) (right histograms) isolated from healthy donors were labeled with CFSE and co-cultured with hyperploid-K-562 cells for seven days. CFSE expression on NK cells, CD3+CD56+CD8+ T cells, CD8+ T cells and CD4+ T cells was examined by flow cytometry at day 0 and day 7. The histograms on the right represent the results obtained with purified NK cells. One representative experiment is shown. (B) The graph shows the mean of the fold induction ± SEM of the percentage of proliferative NK and CD3+ CD8+CD56+ cells relative to the negative control obtained in the experiments using PBMCs (*p < 0.05; **p < 0.01). (C) Results are expressed as the mean of the fold induction ± SEM of the percentage of proliferative NK cells relative to the vehicle-treated control obtained in the experiments using purified NK cells (n = 4; *p < 0.05; **p < 0.01).

Figure 8. Cancer cell hyperploidy induced by chemotherapeutic drugs stimulates IL-2 production by CD4 T cells and triggers NK cell proliferation. (A) PBMCs obtained from four donors were co-cultured with hyperploid cells and the intracellular levels of IL-2 were measured in different lymphocyte subsets. The cytometric profiles show the percentage of IL-2 positive CD4 T cells, CD8 T cells and CD3+CD56+CD8+ cells. (B) Results are expressed as the percentage ± SEM of IL-2 positive cells (*p < 0.05). (C) PBMCs from healthy donors (n = 4) were stained with CFSE and co-cultured with K-562 hyperploid cells in the presence or absence of CsA (1 µM) or anti-IL-2Rα blocking antibody (15 µg/mL) for seven days. The histograms show the results of the CFSE expression of NK cells from one representative donor. (D) Results are expressed as the fold induction ± SEM of the percentage of proliferative NK cells relative to the vehicle-treated control under the conditions detailed in (B) (n = 4; *p < 0.05; **p < 0.01).
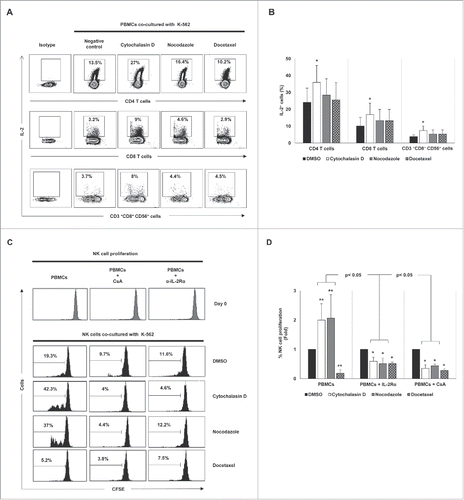
Figure 8. Cancer cell hyperploidy induced by chemotherapeutic drugs stimulates IL-2 production by CD4 T cells and triggers NK cell proliferation. (A) PBMCs obtained from four donors were co-cultured with hyperploid cells and the intracellular levels of IL-2 were measured in different lymphocyte subsets. The cytometric profiles show the percentage of IL-2 positive CD4 T cells, CD8 T cells and CD3+CD56+CD8+ cells. (B) Results are expressed as the percentage ± SEM of IL-2 positive cells (*p < 0.05). (C) PBMCs from healthy donors (n = 4) were stained with CFSE and co-cultured with K-562 hyperploid cells in the presence or absence of CsA (1 µM) or anti-IL-2Rα blocking antibody (15 µg/mL) for seven days. The histograms show the results of the CFSE expression of NK cells from one representative donor. (D) Results are expressed as the fold induction ± SEM of the percentage of proliferative NK cells relative to the vehicle-treated control under the conditions detailed in (B) (n = 4; *p < 0.05; **p < 0.01).

Figure 9. Molecular mechanisms underpinning the upregulation of MICA in cancer cells by hyperploidy-inducing agents. (A) K-562 and HCT-116 cells were exposed to cytochalasin D (0.6 µg/mL) for 48 h and the levels of total and phosphorylated eIF2α (Ser51) were evaluated by immunoblotting (R.U. indicates relative units). Quantification and a representative blot of three independent experiments are shown (*p < 0.05). (B) HCT-116 cells were treated with a PERK inhibitor (GSK2606414, 1 µM) for 2 h before the induction of polyploidy with cytochalasin D and the presence of MICA on the cell surface was evaluated by flow cytometry. Results are expressed as the mean of the fold induction ± SEM of the MFI of MICA in treated cells relative to that of vehicle-treated control cells (n = 4; *p < 0.05). (C and D) K-562 and HCT-116 cells were treated with the ATM inhibitor KU55933 (10 µM) 1 h before treatment with cytochalasin D and the presence of MICA on the cell surface was evaluated by flow cytometry after 48 h. Results are expressed as the mean of fold induction ± SEM of the MFI of cells treated relative to the vehicle-treated control (n = 3; *p < 0.05). (E and F) K-562 and HCT-116 cells were transfected with a plasmid expressing an ATM shRNA or with the mock vector and the expression of MICA was evaluated by flow cytometry 48 h after cytochalasin D treatment. Results are expressed as the mean of fold induction ± SEM of the MFI of cells treated relative to the vehicle-treated control (n = 3; *p < 0.05,). (G) K-562 cells were treated with the ATM inhibitor KU55933 (10 µM) and co-cultured with purified NK cells at an E:T ratio 10:1 for 4 h. The cytotoxic activity of NK cells was evaluated by flow cytometry. The graph shows the percentage of specific lysis. Results are the average of four different experiments ± SEM (*p < 0.05).
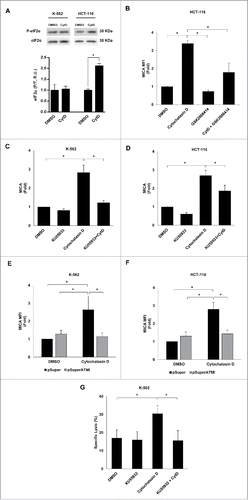
Figure 9. Molecular mechanisms underpinning the upregulation of MICA in cancer cells by hyperploidy-inducing agents. (A) K-562 and HCT-116 cells were exposed to cytochalasin D (0.6 µg/mL) for 48 h and the levels of total and phosphorylated eIF2α (Ser51) were evaluated by immunoblotting (R.U. indicates relative units). Quantification and a representative blot of three independent experiments are shown (*p < 0.05). (B) HCT-116 cells were treated with a PERK inhibitor (GSK2606414, 1 µM) for 2 h before the induction of polyploidy with cytochalasin D and the presence of MICA on the cell surface was evaluated by flow cytometry. Results are expressed as the mean of the fold induction ± SEM of the MFI of MICA in treated cells relative to that of vehicle-treated control cells (n = 4; *p < 0.05). (C and D) K-562 and HCT-116 cells were treated with the ATM inhibitor KU55933 (10 µM) 1 h before treatment with cytochalasin D and the presence of MICA on the cell surface was evaluated by flow cytometry after 48 h. Results are expressed as the mean of fold induction ± SEM of the MFI of cells treated relative to the vehicle-treated control (n = 3; *p < 0.05). (E and F) K-562 and HCT-116 cells were transfected with a plasmid expressing an ATM shRNA or with the mock vector and the expression of MICA was evaluated by flow cytometry 48 h after cytochalasin D treatment. Results are expressed as the mean of fold induction ± SEM of the MFI of cells treated relative to the vehicle-treated control (n = 3; *p < 0.05,). (G) K-562 cells were treated with the ATM inhibitor KU55933 (10 µM) and co-cultured with purified NK cells at an E:T ratio 10:1 for 4 h. The cytotoxic activity of NK cells was evaluated by flow cytometry. The graph shows the percentage of specific lysis. Results are the average of four different experiments ± SEM (*p < 0.05).
Supplemental material

1074378_supplemental_files.zip

Download Zip (279.7 KB)

Reprints and Corporate Permissions

Please note: Selecting permissions does not provide access to the full text of the article, please see our help page How do I view content?

To request a reprint or corporate permissions for this article, please click on the relevant link below:

Academic Permissions

Please note: Selecting permissions does not provide access to the full text of the article, please see our help page How do I view content?

Obtain permissions instantly via Rightslink by clicking on the button below:

If you are unable to obtain permissions via Rightslink, please complete and submit this Permissions form. For more information, please visit our Permissions help page.