1,723
Views
25
CrossRef citations to date
0
Altmetric
Original Research

Oncolytic virotherapy for treatment of breast cancer, including triple-negative breast cancer

, , , , , , , , , , & show all
Article: e1078057 | Received 03 Jun 2015, Accepted 22 Jul 2015, Published online: 26 Feb 2016

Figures & data

Figure 1. Combination of Ad5/3-D24-GMCSF with 4-hydroperoxycyclophosphamide (4-HP-CP) or cyclophosphamide (CP) increases cell killing of MDA-MB-436 TNBC cells in vitro. Viability of MDA-MB-436 TNBC cells after infection with (A) Ad5/3-D24-GMCSF + CP or (B) Ad5/3-D24-GMCSF + 4-HP-CP. Cell viability was measured 5 d after infection by MTS assay. Viability of mock-infected cells was set as 100%. Means with standard deviations of triplicates are shown. VP, viral particles; CP, cyclophosphamide; 4-HP-CP, 4-hydroperoxycyclophosphamide. (A) * p < 0.05 Virus + 4-HP-CP vs. 4-HP-CP alone; ** p < 0.01 Virus + 4-HP-CP vs. virus alone; *** p < 0.001 Virus + 4-HP-CP vs. virus alone. (B) ** p < 0.01 Virus (1 VP/cell) + CP vs. virus alone; Virus (100 VP/cell and 1,000 VP/cell respectively) vs. CP alone.
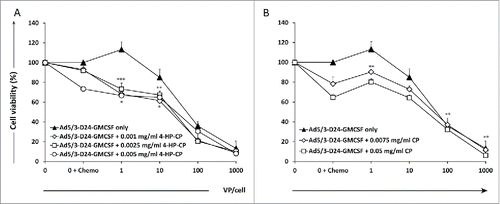
Figure 1. Combination of Ad5/3-D24-GMCSF with 4-hydroperoxycyclophosphamide (4-HP-CP) or cyclophosphamide (CP) increases cell killing of MDA-MB-436 TNBC cells in vitro. Viability of MDA-MB-436 TNBC cells after infection with (A) Ad5/3-D24-GMCSF + CP or (B) Ad5/3-D24-GMCSF + 4-HP-CP. Cell viability was measured 5 d after infection by MTS assay. Viability of mock-infected cells was set as 100%. Means with standard deviations of triplicates are shown. VP, viral particles; CP, cyclophosphamide; 4-HP-CP, 4-hydroperoxycyclophosphamide. (A) * p < 0.05 Virus + 4-HP-CP vs. 4-HP-CP alone; ** p < 0.01 Virus + 4-HP-CP vs. virus alone; *** p < 0.001 Virus + 4-HP-CP vs. virus alone. (B) ** p < 0.01 Virus (1 VP/cell) + CP vs. virus alone; Virus (100 VP/cell and 1,000 VP/cell respectively) vs. CP alone.

Figure 2. Combination of Ad5/3-D24-GMCSF with low-dose CP displays enhanced antitumor efficacy in a TNBC mouse model. Nude/NMRI mice were inoculated orthotopically into two different mammary fat pad sites with human TNBC cells (MDA-MB-436). When tumors reached the size of approximately 5 mm diameter, they were injected with 7 × 10⁹ VP/tumor of Ad5/3-D24-GMCSF or saline on days 1, 4, 8, 15, 29, 43. Low-dose CP (20 mg/kg) was administered to indicated groups intraperitoneally. Tumor sizes are indicated as percentage respective to day 1, which was set as 100%. Data is presented as means + standard deviations. ** p < 0.01 Ad5/3-D24-GMCSF + CP vs. Ad5/3-D24-GMCSF alone on day 33 post-infection. Tumor sizes were compared between the treatment groups using Mann-Whitney U test with Bonferroni correction. n = 8 tumors/group; n = 10 tumors/mock groups.
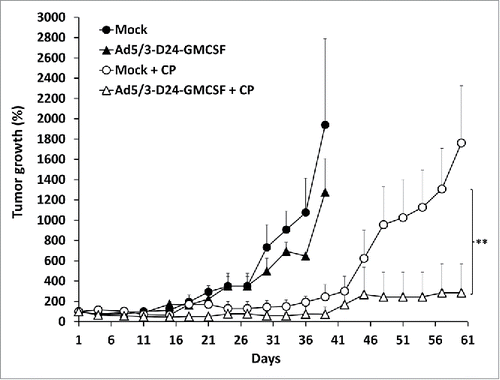
Figure 2. Combination of Ad5/3-D24-GMCSF with low-dose CP displays enhanced antitumor efficacy in a TNBC mouse model. Nude/NMRI mice were inoculated orthotopically into two different mammary fat pad sites with human TNBC cells (MDA-MB-436). When tumors reached the size of approximately 5 mm diameter, they were injected with 7 × 10⁹ VP/tumor of Ad5/3-D24-GMCSF or saline on days 1, 4, 8, 15, 29, 43. Low-dose CP (20 mg/kg) was administered to indicated groups intraperitoneally. Tumor sizes are indicated as percentage respective to day 1, which was set as 100%. Data is presented as means + standard deviations. ** p < 0.01 Ad5/3-D24-GMCSF + CP vs. Ad5/3-D24-GMCSF alone on day 33 post-infection. Tumor sizes were compared between the treatment groups using Mann-Whitney U test with Bonferroni correction. n = 8 tumors/group; n = 10 tumors/mock groups.

Figure 3. Waterfall plots showing radiological and tumor marker responses after Ad5/3-D24-GMCSF treatments in breast cancer patients. (A,B) Percent change in tumor burden relative to pre-treatment baseline is represented. (A) CT, and (B) PET-CT are shown. (C) Percent change in Ca15–3 or CEA levels (patients R170, R249 and R328) relative to pre-treatment baseline is represented. Patient R196 (PD) is not represented in the graph (percent change was not measured). For patient R170, “best response” is shown. TNBC patients are underlined. Mets, metastases. (A,B) n = 13. Patients R247 and R248 have been imaged with both CT and PET-CT; (C) n = 12.
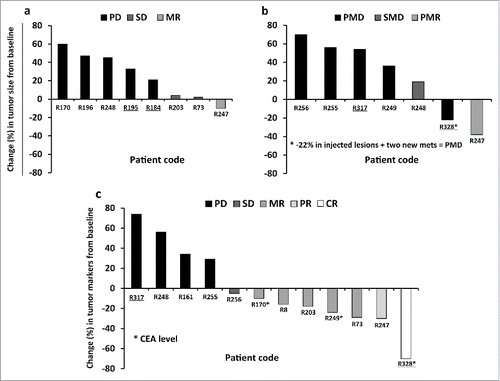
Figure 3. Waterfall plots showing radiological and tumor marker responses after Ad5/3-D24-GMCSF treatments in breast cancer patients. (A,B) Percent change in tumor burden relative to pre-treatment baseline is represented. (A) CT, and (B) PET-CT are shown. (C) Percent change in Ca15–3 or CEA levels (patients R170, R249 and R328) relative to pre-treatment baseline is represented. Patient R196 (PD) is not represented in the graph (percent change was not measured). For patient R170, “best response” is shown. TNBC patients are underlined. Mets, metastases. (A,B) n = 13. Patients R247 and R248 have been imaged with both CT and PET-CT; (C) n = 12.

Table 1. Clinical responses and patient survival. Patients R184, R195, R317, R328 had triple negative breast cancer.

Supplemental material

1078057_Supplemental_Data.docx

Download MS Word (336.6 KB)

Reprints and Corporate Permissions

Please note: Selecting permissions does not provide access to the full text of the article, please see our help page How do I view content?

To request a reprint or corporate permissions for this article, please click on the relevant link below:

Academic Permissions

Please note: Selecting permissions does not provide access to the full text of the article, please see our help page How do I view content?

Obtain permissions instantly via Rightslink by clicking on the button below:

If you are unable to obtain permissions via Rightslink, please complete and submit this Permissions form. For more information, please visit our Permissions help page.