1,618
Views
38
CrossRef citations to date
0
Altmetric
Original Research

Immune checkpoints programmed death 1 ligand 1 and cytotoxic T lymphocyte associated molecule 4 in gastric adenocarcinoma

, , , , , , , , , , , , , , , , , , , , , & show all
Article: e1100789 | Received 02 Jul 2015, Accepted 22 Sep 2015, Published online: 31 May 2016

Figures & data

Figure 1. PD-L1 and CTLA-4 expression (analyzed by immunohistochemistry) is associated with inferior survival in gastric adenocarcinoma. (A) Gastric adenocarcinoma cells show a strong expression of PD-L1 (DAB, brown regions). Surrounding normal tissue and intramucosal glands are PD-L1 negative. Exemplary regions with membranous and cytoplasmatic staining are shown in larger magnification. (B) Representative images showing immunohistochemistry staining of CTLA-4 (DAB, brown regions). (C) Expression of PD-L1 or CTLA-4 in primary tumor cells was associated with inferior overall survival.
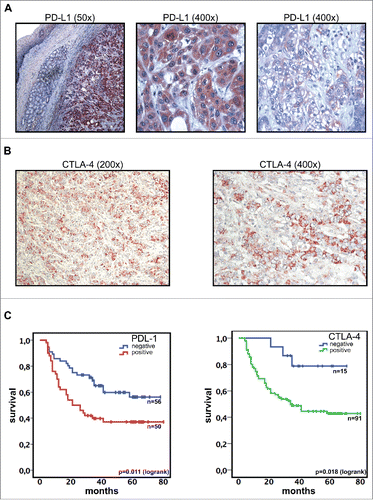
Figure 1. PD-L1 and CTLA-4 expression (analyzed by immunohistochemistry) is associated with inferior survival in gastric adenocarcinoma. (A) Gastric adenocarcinoma cells show a strong expression of PD-L1 (DAB, brown regions). Surrounding normal tissue and intramucosal glands are PD-L1 negative. Exemplary regions with membranous and cytoplasmatic staining are shown in larger magnification. (B) Representative images showing immunohistochemistry staining of CTLA-4 (DAB, brown regions). (C) Expression of PD-L1 or CTLA-4 in primary tumor cells was associated with inferior overall survival.

Figure 2. PD-1 as well as PD-L1 positive T cells were analyzed by flow cytometry and are increased in the tumor microenvironment of gastric adenocarcinoma. (A) Scatter plots and bar graphs showing results of flow cytometric analyses of PD-L1 expression on T and B cells in gastric adenocarcinoma samples (n = 10), TDLN (n = 11), PBMC HC (n = 10) and PBMC AC (n = 14). (B) Scatter plots and bar graphs showing expression of PD-1 on T cells and T-cell subsets in PBMC HC (n = 10), PBMC AC (n = 14), TDLN (n = 10) and gastric adenocarcinoma samples (n = 10) as assessed by flow cytometry. PD-1+ T cells mainly show an effector-memory phenotype with a CD45RA/CCR7 signature (right plot). (C) Exemplary density plot showing expression of PD-1 and PD-L1 on T cells (gated on CD45+CD3+ lymphocytes). Scatter plot showing the percentage of T cells coexpressing PD-L1 and PD-1 in tumor samples (n = 11), PBMC HC (n = 10), PBMC AC (n = 10) and TDLN (n = 10). (D) The spatial distribution of tumor-infiltrating T and B cells expressing PD-L1 was analyzed by four-color immune-fluorescence microscopy. In the left image, tumor cells as well as a fraction of tumor infiltrating CD3+ (green) T cells express PD-L1 (red), whereas B cells (CD20+, magenta) in the tumor microenvironment are mainly PD-L1 negative (right image). (E) Confocal microscopy of T cells in the tumor microenvironment. The distribution of PD-1+ (magenta) T cells was similar to PD-L1+ (red) T cells. Two representative images with either expression of PD-1 alone (left image) or coexpression of PD-1 and PD-L1 (right image) are shown.
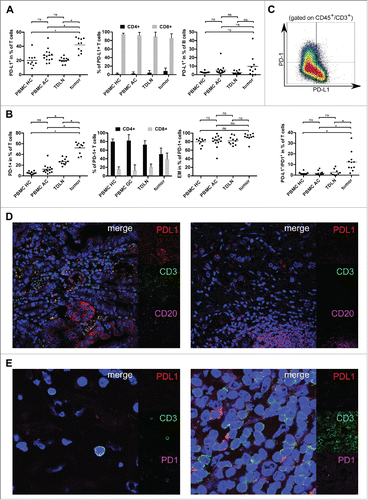
Figure 2. PD-1 as well as PD-L1 positive T cells were analyzed by flow cytometry and are increased in the tumor microenvironment of gastric adenocarcinoma. (A) Scatter plots and bar graphs showing results of flow cytometric analyses of PD-L1 expression on T and B cells in gastric adenocarcinoma samples (n = 10), TDLN (n = 11), PBMC HC (n = 10) and PBMC AC (n = 14). (B) Scatter plots and bar graphs showing expression of PD-1 on T cells and T-cell subsets in PBMC HC (n = 10), PBMC AC (n = 14), TDLN (n = 10) and gastric adenocarcinoma samples (n = 10) as assessed by flow cytometry. PD-1+ T cells mainly show an effector-memory phenotype with a CD45RA−/CCR7− signature (right plot). (C) Exemplary density plot showing expression of PD-1 and PD-L1 on T cells (gated on CD45+CD3+ lymphocytes). Scatter plot showing the percentage of T cells coexpressing PD-L1 and PD-1 in tumor samples (n = 11), PBMC HC (n = 10), PBMC AC (n = 10) and TDLN (n = 10). (D) The spatial distribution of tumor-infiltrating T and B cells expressing PD-L1 was analyzed by four-color immune-fluorescence microscopy. In the left image, tumor cells as well as a fraction of tumor infiltrating CD3+ (green) T cells express PD-L1 (red), whereas B cells (CD20+, magenta) in the tumor microenvironment are mainly PD-L1 negative (right image). (E) Confocal microscopy of T cells in the tumor microenvironment. The distribution of PD-1+ (magenta) T cells was similar to PD-L1+ (red) T cells. Two representative images with either expression of PD-1 alone (left image) or coexpression of PD-1 and PD-L1 (right image) are shown.

Figure 3. Relative proportion and spatial distribution of CTLA-4-expressing T cells and tumor cells in gastric adenocarcinoma were analyzed by flow cytometry and immunofluorescence microscopy. (A) The percentage of CTLA-4 positive T cells was analyzed by flow cytometry and is significantly elevated in gastric adenocarcinoma samples (p <0.05). This difference is mainly based on CD4+ T cells. (B, C) Four color-immunfluorescence microscopy showing CTLA-4 (red) positive tumor cells as well as some CD3+ (green) T cells and CD20+ B cells (magenta). T cells with a coexpression of CTLA-4 (yellow) could be detected in the tumor stroma (B) and close to B cells in peritumoral tertiary lymphoid structures (C). (D) Exemplary density plot and histograms showing expression of CTLA-4 and PD-L1 on CD4+FoxP3+CD25+ regulatory T cells in tumor samples and PBMC of gastric cancer patients (n = 5). Using nuclear staining of FoxP3, we demonstrate a relevant expression of both immune checkpoints on regulatory T cells.
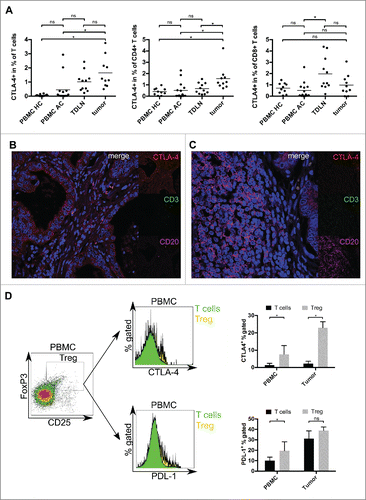
Figure 3. Relative proportion and spatial distribution of CTLA-4-expressing T cells and tumor cells in gastric adenocarcinoma were analyzed by flow cytometry and immunofluorescence microscopy. (A) The percentage of CTLA-4 positive T cells was analyzed by flow cytometry and is significantly elevated in gastric adenocarcinoma samples (p <0.05). This difference is mainly based on CD4+ T cells. (B, C) Four color-immunfluorescence microscopy showing CTLA-4 (red) positive tumor cells as well as some CD3+ (green) T cells and CD20+ B cells (magenta). T cells with a coexpression of CTLA-4 (yellow) could be detected in the tumor stroma (B) and close to B cells in peritumoral tertiary lymphoid structures (C). (D) Exemplary density plot and histograms showing expression of CTLA-4 and PD-L1 on CD4+FoxP3+CD25+ regulatory T cells in tumor samples and PBMC of gastric cancer patients (n = 5). Using nuclear staining of FoxP3, we demonstrate a relevant expression of both immune checkpoints on regulatory T cells.

Figure 4. Comprehensive mutational analysis and correlation with immune checkpoint expression. No correlation between somatic mutations detected by targeted next-generation sequencing and PD-L1 or CTLA-4 expression status (n = 113).
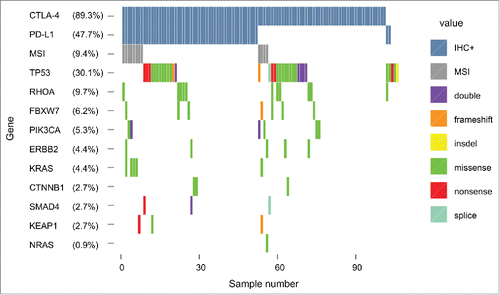
Figure 4. Comprehensive mutational analysis and correlation with immune checkpoint expression. No correlation between somatic mutations detected by targeted next-generation sequencing and PD-L1 or CTLA-4 expression status (n = 113).

Table 1. Patient characteristics.

Table 2. Correlation of prognosis and expression of PD-L1 and CTLA-4 using Kaplan–Meier analysis and Cox's regression.

Supplemental material

KONI_A_1100789_s02.zip

Download Zip (5.2 MB)

Reprints and Corporate Permissions

Please note: Selecting permissions does not provide access to the full text of the article, please see our help page How do I view content?

To request a reprint or corporate permissions for this article, please click on the relevant link below:

Academic Permissions

Please note: Selecting permissions does not provide access to the full text of the article, please see our help page How do I view content?

Obtain permissions instantly via Rightslink by clicking on the button below:

If you are unable to obtain permissions via Rightslink, please complete and submit this Permissions form. For more information, please visit our Permissions help page.