1,793
Views
21
CrossRef citations to date
0
Altmetric
Original Research

The multidrug-resistance transporter Abcc3 protects NK cells from chemotherapy in a murine model of malignant glioma

, , , , , & show all
Article: e1108513 | Received 26 Jun 2015, Accepted 10 Oct 2015, Published online: 19 Apr 2016

Figures & data

Figure 1. TMZ treatment influences local and peripheral immune cell frequency. (A) Experimental schema of in vivo treatment. C57BL6 were i.c. injected with GL261 cells and treated for 5 d with i.p. injection of 5 mg/kg TMZ or vehicle (DMSO) 9 d after tumor implantation. On days 9–13 and 19 after tumor implantation (24–96 and 240 h after TMZ treatment), n = 5 mice per group/each time point were sacrificed for immune monitoring. (B) Peripheral percentages of CD8+T cells (CD8+CD3+): 22.2 ± 1.2% vs. 15.5 ± 0.2% at 24 h; 21.1 ± 2.0% vs. 5.5 ± 1.0% at 48 h; 19.8 ± 1.4% vs. 10.8 ± 1.3% at 72 h; 22.4 ± 2.1 vs. 16.6 ± 2.1% at 96 h; 22.6 ± 0.4% vs. 17.3± 1.4% at 240 h, controls vs. TMZ-treated mice, respectively; *p < 0.01; ***p <0.0001. (C) Percentages of blood NK cells (NK1.1+CD3): 4.8 ± 1.2% vs. 9.8 ± 3.2% at 24 h; 7.2 ± 1.2% vs. 13.3 ± 1.2% at 48 h; 6.3 ± 1.6% vs. 20.2 ± 1.9% at 72 h; 10.2 ± 2.1% vs. 20.6 ± 2.3% at 96 h, 7.2 ± 2.1% vs. 21.8 ± 2.3% at 240 h, controls vs. TMZ-treated mice respectively; *p < 0.01; ***p < 0.0001. (D) Tumor-infiltrating CD8+ T cells: 10.3 ± 1.2% vs. 10.5 ± 0.2% at 24 h; 15.2 ± 2.1% vs. 6.5 ±1.0% at 48 h; 16.3 ± 2.7% vs. 11.2 ± 2.6% at 72 h; 15.7 ± 2.2% vs. 19.3 ± 1.1% at 96 h, 18.2 ± 2.2% vs. 20.4 ± 2.3% at 240 h, controls vs. TMZ-treated mice respectively; **p < 0.001. (E) Tumor-infiltrating NK cells during and after TMZ administration: 7.2 ± 12.5% vs. 12.5 ± 7.4% at 24 h; 9.1 ± 4.5% vs. 21.1 ± 5.3% at 48 h; 11.3 ± 5.6% vs. 36.2 ± 8.1% at 72 h; 14.5 ± 7.6% vs. 39.2 ± 9.2% at 96 h; 21.4 ± 6.5% vs. 48.9 ± 7.7% at 240 h, controls vs. treated mice respectively; *p < 0.01; ***p < 0.0001. (F) Characterization of immune infiltration in gliomas by IF at 72 h after beginning of TMZ treatment. (G) Quantitative determination of TILs by flow cytometry obtained from the same groups of gliomas used for IF studies.
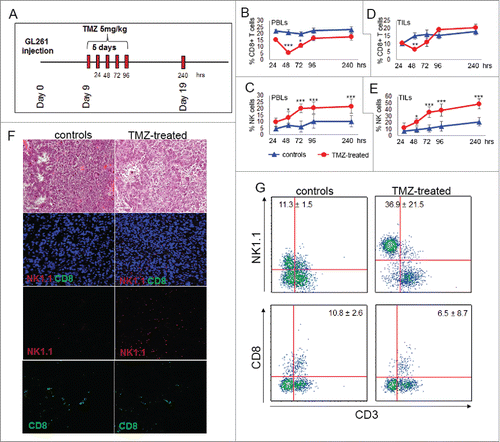
Figure 1. TMZ treatment influences local and peripheral immune cell frequency. (A) Experimental schema of in vivo treatment. C57BL6 were i.c. injected with GL261 cells and treated for 5 d with i.p. injection of 5 mg/kg TMZ or vehicle (DMSO) 9 d after tumor implantation. On days 9–13 and 19 after tumor implantation (24–96 and 240 h after TMZ treatment), n = 5 mice per group/each time point were sacrificed for immune monitoring. (B) Peripheral percentages of CD8+T cells (CD8+CD3+): 22.2 ± 1.2% vs. 15.5 ± 0.2% at 24 h; 21.1 ± 2.0% vs. 5.5 ± 1.0% at 48 h; 19.8 ± 1.4% vs. 10.8 ± 1.3% at 72 h; 22.4 ± 2.1 vs. 16.6 ± 2.1% at 96 h; 22.6 ± 0.4% vs. 17.3± 1.4% at 240 h, controls vs. TMZ-treated mice, respectively; *p < 0.01; ***p <0.0001. (C) Percentages of blood NK cells (NK1.1+CD3−): 4.8 ± 1.2% vs. 9.8 ± 3.2% at 24 h; 7.2 ± 1.2% vs. 13.3 ± 1.2% at 48 h; 6.3 ± 1.6% vs. 20.2 ± 1.9% at 72 h; 10.2 ± 2.1% vs. 20.6 ± 2.3% at 96 h, 7.2 ± 2.1% vs. 21.8 ± 2.3% at 240 h, controls vs. TMZ-treated mice respectively; *p < 0.01; ***p < 0.0001. (D) Tumor-infiltrating CD8+ T cells: 10.3 ± 1.2% vs. 10.5 ± 0.2% at 24 h; 15.2 ± 2.1% vs. 6.5 ±1.0% at 48 h; 16.3 ± 2.7% vs. 11.2 ± 2.6% at 72 h; 15.7 ± 2.2% vs. 19.3 ± 1.1% at 96 h, 18.2 ± 2.2% vs. 20.4 ± 2.3% at 240 h, controls vs. TMZ-treated mice respectively; **p < 0.001. (E) Tumor-infiltrating NK cells during and after TMZ administration: 7.2 ± 12.5% vs. 12.5 ± 7.4% at 24 h; 9.1 ± 4.5% vs. 21.1 ± 5.3% at 48 h; 11.3 ± 5.6% vs. 36.2 ± 8.1% at 72 h; 14.5 ± 7.6% vs. 39.2 ± 9.2% at 96 h; 21.4 ± 6.5% vs. 48.9 ± 7.7% at 240 h, controls vs. treated mice respectively; *p < 0.01; ***p < 0.0001. (F) Characterization of immune infiltration in gliomas by IF at 72 h after beginning of TMZ treatment. (G) Quantitative determination of TILs by flow cytometry obtained from the same groups of gliomas used for IF studies.

Figure 2. Abcc3 is responsible for NK cell chemo-resistance. (A and B) Relative expression of Abca6 and Abcc3 transporters in blood NK cells at 72 h, **p < 0.001. (C and D) Time course of Abca6 and Abcc3 expression in PBLs from naïve mice (n = 20) treated in vitro with 1 μM TMZ or DMSO; *p = 0.01, **p < 0.005 and ***p < 0.0001. (E and F) Abcc3 levels in NK and CD8+ T cells from glioma-bearing mice (n = 5/group) after three treatments of TMZ (red line) or DMSO (green line). (G and H) multidrug-resistance activity assay in NK and CD8+ T cells from PBLs of naive mice (n = 25) treated in vitro with 1 μM TMZ or DMSO for 4 h. MAF values > 25 are indicative of multidrug-resistant phenotype.
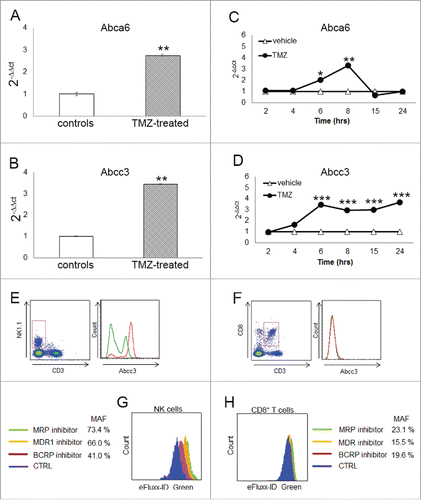
Figure 2. Abcc3 is responsible for NK cell chemo-resistance. (A and B) Relative expression of Abca6 and Abcc3 transporters in blood NK cells at 72 h, **p < 0.001. (C and D) Time course of Abca6 and Abcc3 expression in PBLs from naïve mice (n = 20) treated in vitro with 1 μM TMZ or DMSO; *p = 0.01, **p < 0.005 and ***p < 0.0001. (E and F) Abcc3 levels in NK and CD8+ T cells from glioma-bearing mice (n = 5/group) after three treatments of TMZ (red line) or DMSO (green line). (G and H) multidrug-resistance activity assay in NK and CD8+ T cells from PBLs of naive mice (n = 25) treated in vitro with 1 μM TMZ or DMSO for 4 h. MAF values > 25 are indicative of multidrug-resistant phenotype.

Figure 3. NK cells exhibit resistance to TMZ-induced apoptosis. (A and C) Apoptosis induced by TMZ treatment in NK and CD8+ T cells from PBLs of naive mice (n = 20). EA and LA represent early and late apoptosis, respectively. (B) Early and late apoptosis of Abcc3+ and Abcc3 NK cells treated in vitro with 1 μM TMZ. (D) Western blot analysis and densitometric quantification of pAkt in blood immune-separated NK and CD8+ T cells of naïve mice (n = 20) treated with 1 μM TMZ or DMSO. (E) Intracellular staining of pAkt in blood-derived Abcc3+NK and Abcc3+CD8+ T cells from glioma-bearing mice (n = 4/group) at 72 h. (F) Representative dot plots showing apoptosis in NK cells treated for 4 h in vitro with 1 μM TMZ and 25 μM Abcc3 inhibitor added to the medium 30 min before (pre-MK571) or after (post MK571) the pharmacological treatment. *p < 0.01, **p < 0.001 and ***p < 0.0001.
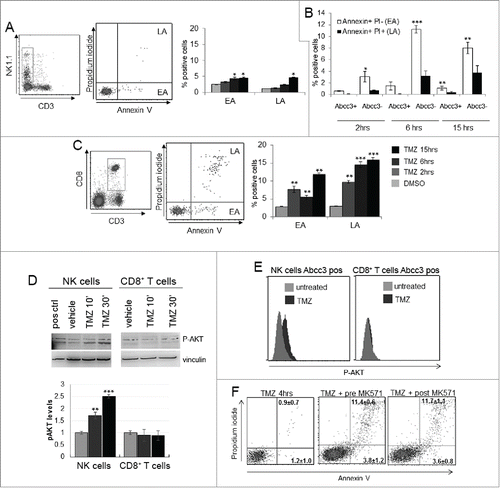
Figure 3. NK cells exhibit resistance to TMZ-induced apoptosis. (A and C) Apoptosis induced by TMZ treatment in NK and CD8+ T cells from PBLs of naive mice (n = 20). EA and LA represent early and late apoptosis, respectively. (B) Early and late apoptosis of Abcc3+ and Abcc3− NK cells treated in vitro with 1 μM TMZ. (D) Western blot analysis and densitometric quantification of pAkt in blood immune-separated NK and CD8+ T cells of naïve mice (n = 20) treated with 1 μM TMZ or DMSO. (E) Intracellular staining of pAkt in blood-derived Abcc3+NK and Abcc3+CD8+ T cells from glioma-bearing mice (n = 4/group) at 72 h. (F) Representative dot plots showing apoptosis in NK cells treated for 4 h in vitro with 1 μM TMZ and 25 μM Abcc3 inhibitor added to the medium 30 min before (pre-MK571) or after (post MK571) the pharmacological treatment. *p < 0.01, **p < 0.001 and ***p < 0.0001.

Figure 4. The developmental stage of NK cells from TMZ-treated mice was influenced by TMZ. (A) Migration of NK cells from PBLs of TMZ-treated and control mice (n = 30/group) at 72 h toward medium from DMSO-treated (white bars) and TMZ-treated (striped bars) GL261 cells. **p < 0.005; ***p < 0.0001. (B) CD49b and CD49d integrin surface expression in blood-derived NK cells from TMZ-treated and control mice (n = 4/group) isolated at 72 h; p < 0.001. (C and D) Representative dot plots of the NK cell four-developmental stages basing on surface expression of CD27 and CD11b in blood of TMZ- and vehicle-treated mice on days 12 (C) and 19 (D); p < 0.01. (E and F) Representative dot plots showing CD27 and CD11b expression in tumor-infiltrating NK cells isolated on day 12 (E) and 19 (F) from gliomas, p < 0.005.
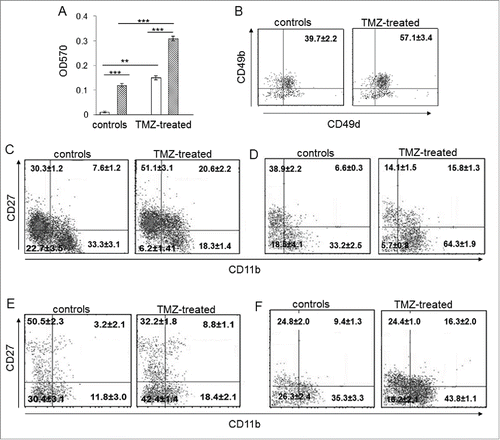
Figure 4. The developmental stage of NK cells from TMZ-treated mice was influenced by TMZ. (A) Migration of NK cells from PBLs of TMZ-treated and control mice (n = 30/group) at 72 h toward medium from DMSO-treated (white bars) and TMZ-treated (striped bars) GL261 cells. **p < 0.005; ***p < 0.0001. (B) CD49b and CD49d integrin surface expression in blood-derived NK cells from TMZ-treated and control mice (n = 4/group) isolated at 72 h; p < 0.001. (C and D) Representative dot plots of the NK cell four-developmental stages basing on surface expression of CD27 and CD11b in blood of TMZ- and vehicle-treated mice on days 12 (C) and 19 (D); p < 0.01. (E and F) Representative dot plots showing CD27 and CD11b expression in tumor-infiltrating NK cells isolated on day 12 (E) and 19 (F) from gliomas, p < 0.005.

Figure 5. Cytotoxicity of glioma-infiltrating NK cells is promoted by TMZ treatment. (A) IFNγ production in blood NK cells (n = 4/group); p < 0.005. (B) Cytotoxic specificity of peripheral NK cells from naïve mice, TMZ- and vehicle-treated glioma-bearing mice (n = 10/group) against GL261 cells in vitro. Effector:target ratio (E:T) 10:1, 20:1, 40:1. p < 0.001. (C and D) Relative expression of Prf1, GzmB and IFNγ in TILs at early (C) and later time point (D). *p < 0.01; **p < 0.001; ***p < 0.0001.
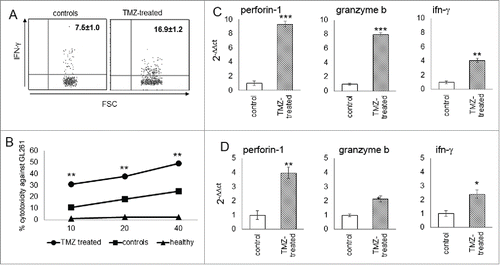
Figure 5. Cytotoxicity of glioma-infiltrating NK cells is promoted by TMZ treatment. (A) IFNγ production in blood NK cells (n = 4/group); p < 0.005. (B) Cytotoxic specificity of peripheral NK cells from naïve mice, TMZ- and vehicle-treated glioma-bearing mice (n = 10/group) against GL261 cells in vitro. Effector:target ratio (E:T) 10:1, 20:1, 40:1. p < 0.001. (C and D) Relative expression of Prf1, GzmB and IFNγ in TILs at early (C) and later time point (D). *p < 0.01; **p < 0.001; ***p < 0.0001.

Figure 6. TMZ modifies glioma microenvironment favoring an NK cell antitumor activity. (A and B) Relative expression of the most immunosuppressive molecules normally expressed in glioma cells: galectin-1, −3, −9 (3.85 ± 0.03-, 2.94 ± 0.02- and 2.22 ± 0.03-fold, respectively vs. controls) and H2-q1 (2.81 ± 0.08-fold vs. controls). (C) Cytokine and chemokine protein array blots with pixel density quantification of lysates from gliomas of control and TMZ-treated mice (n = 5 / group of treatment). Blots are representative of experiments performed on a pool of gliomas from controls or TMZ-treated mice. Cytokines and chemokines which expression changed in both experiments were considered: IFNγ, CCL3, TNF-α, IL-7 and IL-27 were 1.9 ± 0.6-, 1.6 ± 0.4-, 1.7 ± 0.2-, 1.8 ± 0.4-, 1.6 ± 0.2-fold higher, CXCL10 and CCL5 were 0.6 ± 0.7- and 0.7 ± 0.4-fold lower in TMZ-treated compared to controls; *p ≤ 0.01. (D) TGF-β1 and -β2 levels in medium of GL261 cells treated in vitro with DMSO or TMZ: from 23.2 ± 2.5 pg/mL and 478.4 ± 19.3 pg/mL in vehicle to 13.2 ± 2.2 pg/mL and 283.8 ± 25.9 pg/mL in TMZ-treated cells. (E) Relative expression of Nkg2d ligands in GL261 cells treated in vitro with 50 and 150 μM TMZ (striped and black bars, respectively) and DMSO used as vehicle (white bars) at different time points. *p < 0.01; **p < 0.001; ***p < 0.0001.
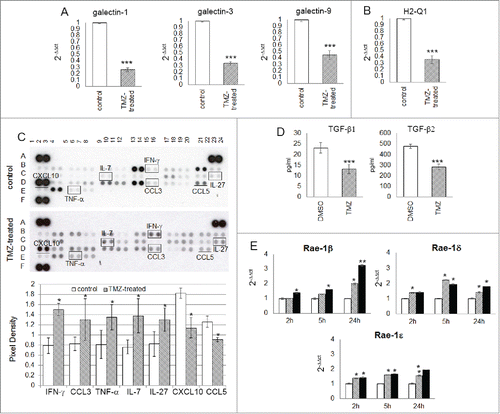
Figure 6. TMZ modifies glioma microenvironment favoring an NK cell antitumor activity. (A and B) Relative expression of the most immunosuppressive molecules normally expressed in glioma cells: galectin-1, −3, −9 (3.85 ± 0.03-, 2.94 ± 0.02- and 2.22 ± 0.03-fold, respectively vs. controls) and H2-q1 (2.81 ± 0.08-fold vs. controls). (C) Cytokine and chemokine protein array blots with pixel density quantification of lysates from gliomas of control and TMZ-treated mice (n = 5 / group of treatment). Blots are representative of experiments performed on a pool of gliomas from controls or TMZ-treated mice. Cytokines and chemokines which expression changed in both experiments were considered: IFNγ, CCL3, TNF-α, IL-7 and IL-27 were 1.9 ± 0.6-, 1.6 ± 0.4-, 1.7 ± 0.2-, 1.8 ± 0.4-, 1.6 ± 0.2-fold higher, CXCL10 and CCL5 were 0.6 ± 0.7- and 0.7 ± 0.4-fold lower in TMZ-treated compared to controls; *p ≤ 0.01. (D) TGF-β1 and -β2 levels in medium of GL261 cells treated in vitro with DMSO or TMZ: from 23.2 ± 2.5 pg/mL and 478.4 ± 19.3 pg/mL in vehicle to 13.2 ± 2.2 pg/mL and 283.8 ± 25.9 pg/mL in TMZ-treated cells. (E) Relative expression of Nkg2d ligands in GL261 cells treated in vitro with 50 and 150 μM TMZ (striped and black bars, respectively) and DMSO used as vehicle (white bars) at different time points. *p < 0.01; **p < 0.001; ***p < 0.0001.
Supplemental material

Supplementary files

Download Zip (464.4 KB)