1,069
Views
17
CrossRef citations to date
0
Altmetric
Original Research

Anti-α-enolase antibody limits the invasion of myeloid-derived suppressor cells and attenuates their restraining effector T cell response

, , , , &
Article: e1112940 | Received 24 Jul 2015, Accepted 22 Oct 2015, Published online: 29 Apr 2016

Figures & data

Figure 1. Myeloid-derived suppressor cells express ENO1 on their surface in both PDA patients and tumor-bearing mice. (A) Freshly collected blood from PDA patients and healthy individuals was immediately stained to evaluate the presence of MDSC defined as CD11b+CD33lowCD14HLA-DRlow. In the graph, the percentage of CD11b+CD33low or CD11b+CD33high cells is plotted as whiskers from minimun to maximun value for PDA patients (black whiskers) and age-matched healthy individuals (white whiskers). Mean value for each group is also represented. *, ***p values < 0.05 and 0.0001 significantly discriminate PDA patients from healthy individuals. (B) ENO1 expression was evaluated on the aforementioned myeloid populations and the geometrical mean intensity of fluorescence was evaluated for each PDA patient (black bars) and age-matched healthy individual (white bars) after subtraction of the fluorescence intensity registered with the isotype IgG (Δ geo mean). Bars represent mean ± SEM. (C) Dot plots are representative of the gating strategy for the analysis of MDSC in human blood and of ENO1 expression on human MDSC. (C) MDSC defined as CD11b+Gr1+ cells were evaluated in the freshly collected blood from KC mice (black whiskers from minimun to maximun value; n = 5) and age-matched Cre mice (white whiskers from minimun to maximun value; n = 5) at different time point as indicated. *, **, ***p values < 0.05, 0.001 and 0.0001 significantly discriminate KC mice from Cre mice. (D) Representative flow cytometry histograms of ENO1 expression on CD11b+Gr1+ cells cultured or not (green peak) in the presence of LPS for 48 and 72 h and labeled with an anti-ENO1 mAb (blue and orange line peaks respectively) or an isotype ctrl (black peak). One of three independent flow cytometry evaluations is shown.
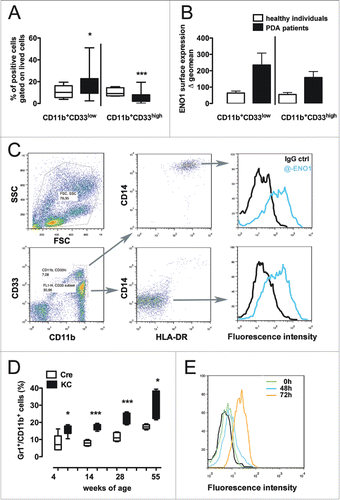
Figure 1. Myeloid-derived suppressor cells express ENO1 on their surface in both PDA patients and tumor-bearing mice. (A) Freshly collected blood from PDA patients and healthy individuals was immediately stained to evaluate the presence of MDSC defined as CD11b+CD33lowCD14−HLA-DRlow. In the graph, the percentage of CD11b+CD33low or CD11b+CD33high cells is plotted as whiskers from minimun to maximun value for PDA patients (black whiskers) and age-matched healthy individuals (white whiskers). Mean value for each group is also represented. *, ***p values < 0.05 and 0.0001 significantly discriminate PDA patients from healthy individuals. (B) ENO1 expression was evaluated on the aforementioned myeloid populations and the geometrical mean intensity of fluorescence was evaluated for each PDA patient (black bars) and age-matched healthy individual (white bars) after subtraction of the fluorescence intensity registered with the isotype IgG (Δ geo mean). Bars represent mean ± SEM. (C) Dot plots are representative of the gating strategy for the analysis of MDSC in human blood and of ENO1 expression on human MDSC. (C) MDSC defined as CD11b+Gr1+ cells were evaluated in the freshly collected blood from KC mice (black whiskers from minimun to maximun value; n = 5) and age-matched Cre mice (white whiskers from minimun to maximun value; n = 5) at different time point as indicated. *, **, ***p values < 0.05, 0.001 and 0.0001 significantly discriminate KC mice from Cre mice. (D) Representative flow cytometry histograms of ENO1 expression on CD11b+Gr1+ cells cultured or not (green peak) in the presence of LPS for 48 and 72 h and labeled with an anti-ENO1 mAb (blue and orange line peaks respectively) or an isotype ctrl (black peak). One of three independent flow cytometry evaluations is shown.

Figure 2. MDSC adhesion to endothelial cells after ENO1-treatment. (A) Bone marrow-generated MDSC were labeled with fluorescein-conjugated anti-CD11b Ab, and untreated or treated with anti-ENO1 mAb before seeding on TNF-α pre-activated endothelial cells for 1 h. Adherent cells were fixed and stained with crystal violet and counted in 10 fields/each condition. Graphs represent the mean ± SEM of two independent experiments in which 6 × 10⁴ and 3 × 10⁴ CD11b+ cells were seeded, respectively. ***p values < 0.0001, which significantly discriminate the ctrl- from ENO1-MDSC. (B) Representative pictures of CD11b+ cells untreated or treated with anti-ENO1 mAb in fluorescence (green; upper panels) and of the monolayer of endothelial cells in bright field (lower panels) at 10x magnification. (C) Adhesion to extracellular matrix components was assessed by seeding 1 × 10⁵ cells/well of ctrl- and ENO1-MDSC and CF-PAC-1, as a positive control, in duplicate on a 24-well pre-coated plate. After 90 min, adherent cells were washed and stained. OD was read at 570 nm. Bars represent mean ± SEM.
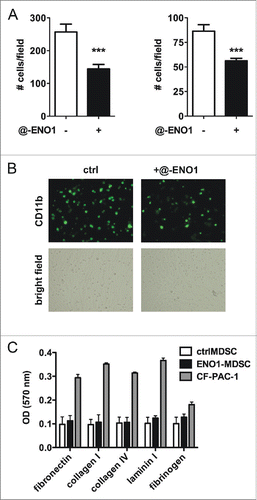
Figure 2. MDSC adhesion to endothelial cells after ENO1-treatment. (A) Bone marrow-generated MDSC were labeled with fluorescein-conjugated anti-CD11b Ab, and untreated or treated with anti-ENO1 mAb before seeding on TNF-α pre-activated endothelial cells for 1 h. Adherent cells were fixed and stained with crystal violet and counted in 10 fields/each condition. Graphs represent the mean ± SEM of two independent experiments in which 6 × 10⁴ and 3 × 10⁴ CD11b+ cells were seeded, respectively. ***p values < 0.0001, which significantly discriminate the ctrl- from ENO1-MDSC. (B) Representative pictures of CD11b+ cells untreated or treated with anti-ENO1 mAb in fluorescence (green; upper panels) and of the monolayer of endothelial cells in bright field (lower panels) at 10x magnification. (C) Adhesion to extracellular matrix components was assessed by seeding 1 × 10⁵ cells/well of ctrl- and ENO1-MDSC and CF-PAC-1, as a positive control, in duplicate on a 24-well pre-coated plate. After 90 min, adherent cells were washed and stained. OD was read at 570 nm. Bars represent mean ± SEM.

Figure 3. Anti-ENO1 mAb impairs MDSC invasion both in vitro and in vivo. A. A total of 105 and 5 × 10⁴ MDSC were untreated or treated with anti-ENO1 mAb before being seeded on matrigel-coated transwells for 2 h. Invading cells were fixed and stained with crystal violet and counted in 10 fields/each condition. Graphs represent the mean ± SEM of two independent experiments. **, ***p values < 0.001 and 0.0001, which significantly discriminate the ctrl- from ENO1-MDSC. (B) Representative pictures of invading ctrl- and ENO1-MDSC after crystal violet staining. Magnification 4x. (C) A total of 2 × 10⁶ of Cytotrack red-labeled ctrl- and ENO1-MDSC were injected subcutaneously into the hind-leg footpad of the mice. The number of MDSC that had migrated to the popliteal lymph nodes was evaluated by flow cytometry. Results are the mean ± SEM of six lymph node samples/group. (D) Sera from vaccinated mice were evaluated for the presence of specific anti-ENO1 antibodies by a direct ELISA. OD values, subtracted of the background values, are plotted as whiskers from minimum to maximum value for ENO1-vaccinated (black whiskers) and empty-vaccinated (white whiskers) mice. Mean value for each group is also represented. *p values < 0.05 significantly discriminate ENO1-vaccinated from empty-vaccinated mice. (E) CD11b+Gr1+ cells were evaluated in the freshly collected pancreatic tissues. Percentage is plotted as whiskers from minimum to maximum value for empty- (white whiskers) and ENO1-vaccinated (black whiskers) mice. Mean value for each group is also represented. ***p values < 0.0001 significantly discriminate ENO1-vaccinated from empty-vaccinated mice.
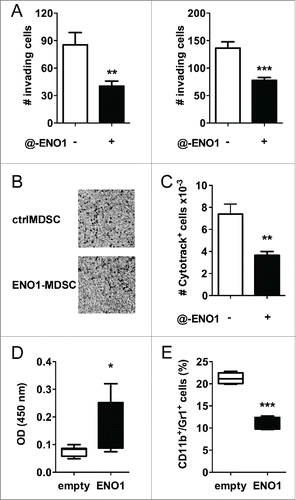
Figure 3. Anti-ENO1 mAb impairs MDSC invasion both in vitro and in vivo. A. A total of 105 and 5 × 10⁴ MDSC were untreated or treated with anti-ENO1 mAb before being seeded on matrigel-coated transwells for 2 h. Invading cells were fixed and stained with crystal violet and counted in 10 fields/each condition. Graphs represent the mean ± SEM of two independent experiments. **, ***p values < 0.001 and 0.0001, which significantly discriminate the ctrl- from ENO1-MDSC. (B) Representative pictures of invading ctrl- and ENO1-MDSC after crystal violet staining. Magnification 4x. (C) A total of 2 × 10⁶ of Cytotrack red-labeled ctrl- and ENO1-MDSC were injected subcutaneously into the hind-leg footpad of the mice. The number of MDSC that had migrated to the popliteal lymph nodes was evaluated by flow cytometry. Results are the mean ± SEM of six lymph node samples/group. (D) Sera from vaccinated mice were evaluated for the presence of specific anti-ENO1 antibodies by a direct ELISA. OD values, subtracted of the background values, are plotted as whiskers from minimum to maximum value for ENO1-vaccinated (black whiskers) and empty-vaccinated (white whiskers) mice. Mean value for each group is also represented. *p values < 0.05 significantly discriminate ENO1-vaccinated from empty-vaccinated mice. (E) CD11b+Gr1+ cells were evaluated in the freshly collected pancreatic tissues. Percentage is plotted as whiskers from minimum to maximum value for empty- (white whiskers) and ENO1-vaccinated (black whiskers) mice. Mean value for each group is also represented. ***p values < 0.0001 significantly discriminate ENO1-vaccinated from empty-vaccinated mice.

Figure 4. Cytokine secretion and surface marker expression after ENO1-treatment. (A) Bone marrow-generated MDSC were untreated or treated with anti-ENO1 and cultured at 37°C for a further 24 h. Supernatants were collected and evaluated for the presence of TNF-α, IL-6, IL-10 and TGF-β. Graphs represent the mean ± SEM of four independent experiments. *p value < 0.05 which significantly discriminates ctrlMDSC from ENO1-MDSC. (B) Cells were labeled and analyzed by flow cytometry for the expression of indicated co-stimulatory and surface markers. The mean ± SEM of fluorescence intensity from two independent experiments is shown in the graph for ctrl- (white bars) and ENO1-MDSC (black bars). ***p value < 0.0001 which significantly discriminates ctrlMDSC from ENO1-MDSC. (C) ARG-1 activity evaluated in ctrl- and ENO1-MDSC lysates. The graph represents the mean ± SEM of values obtained from three independent experiments, *p value < 0.05 which significantly discriminates ctrlMDSC from ENO1-MDSC. (D) Phosphoprotein analysis with total lysate from ctrl- and ENO1-MDSC with the Bio-Plex Pro™ Cell Signaling Assay. Graphs represent the mean ± SEM of fluorescence Absorbance (AU) from phosphoproteins after normalization with total protein concentration. *, **p values < 0.05 and 0.001, which significantly discriminate ctrl- and ENO1-MDSC.
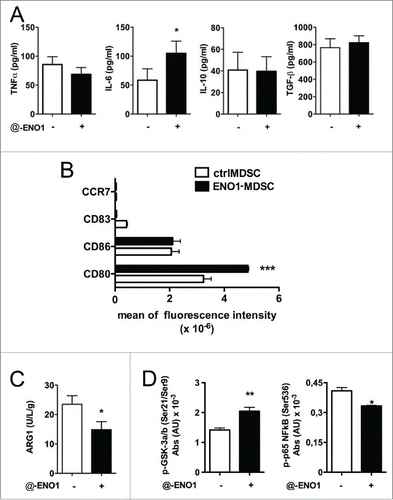
Figure 4. Cytokine secretion and surface marker expression after ENO1-treatment. (A) Bone marrow-generated MDSC were untreated or treated with anti-ENO1 and cultured at 37°C for a further 24 h. Supernatants were collected and evaluated for the presence of TNF-α, IL-6, IL-10 and TGF-β. Graphs represent the mean ± SEM of four independent experiments. *p value < 0.05 which significantly discriminates ctrlMDSC from ENO1-MDSC. (B) Cells were labeled and analyzed by flow cytometry for the expression of indicated co-stimulatory and surface markers. The mean ± SEM of fluorescence intensity from two independent experiments is shown in the graph for ctrl- (white bars) and ENO1-MDSC (black bars). ***p value < 0.0001 which significantly discriminates ctrlMDSC from ENO1-MDSC. (C) ARG-1 activity evaluated in ctrl- and ENO1-MDSC lysates. The graph represents the mean ± SEM of values obtained from three independent experiments, *p value < 0.05 which significantly discriminates ctrlMDSC from ENO1-MDSC. (D) Phosphoprotein analysis with total lysate from ctrl- and ENO1-MDSC with the Bio-Plex Pro™ Cell Signaling Assay. Graphs represent the mean ± SEM of fluorescence Absorbance (AU) from phosphoproteins after normalization with total protein concentration. *, **p values < 0.05 and 0.001, which significantly discriminate ctrl- and ENO1-MDSC.

Figure 5. Suppressive function of MDSC after ENO1-treatment. (A) The suppressive function of MDSC was measured using 1 × 10⁶ Cytotrack Red-labeled anti-CD3 plus anti-CD28 mAbs activated lymph node cells, either cultured or not cultured (gray bars) with ctrl- (white bars) or ENO1-MDSC (black bars). Cytotrack Red dilution in both CD4+ and CD8+ T cells was evaluated by flow cytometry. Graphs represent the mean ± SEM of percentage of CD4+ (upper panel) and CD8+ (lower panel) T cells in each generation, as evaluated from the histogram analysis shown in Panel B. *, **, ***p values < 0.05, 0.001 and 0.0001 significantly discriminate ctrl- from ENO1-MDSC. (B) Lymph node cells collected after 72 h of co-culture were stained and gated for CD4+ (left panels) and CD8+ (right panels) expression. Green peaks represent the non-dividing population, empty peaks indicate the different generations due to the vital dye dilution and the red line is the fitting curve evaluated by the FCSExpress 5 Software. For the analysis, a ratio of 0.5 between each generation was set. Representative results from two independent experiments are shown. (C) Supernatants from lymph node cells and ctrl- or ENO1-MDSC co-cultures were analyzed for the presence of IFNγ, IL-17, Il-10 and TGF-β. Graphs represent the mean ± SEM of values obtained from three independent experiments. *, **, ***p values < 0.05, 0.001 and 0.0001, which significantly discriminate activated T cells alone from those co-cultured with ctrlMDSC and ENO1-MDSC. §, §§p values < 0.05 and 0.001, which significantly discriminate T cells co-cultured with ctrlMDSC from T cells co-cultured with ENO1-MDSC.
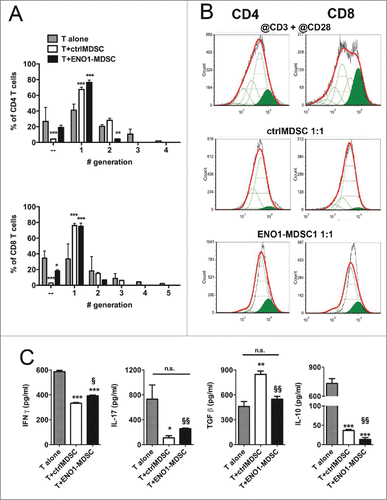
Figure 5. Suppressive function of MDSC after ENO1-treatment. (A) The suppressive function of MDSC was measured using 1 × 10⁶ Cytotrack Red-labeled anti-CD3 plus anti-CD28 mAbs activated lymph node cells, either cultured or not cultured (gray bars) with ctrl- (white bars) or ENO1-MDSC (black bars). Cytotrack Red dilution in both CD4+ and CD8+ T cells was evaluated by flow cytometry. Graphs represent the mean ± SEM of percentage of CD4+ (upper panel) and CD8+ (lower panel) T cells in each generation, as evaluated from the histogram analysis shown in Panel B. *, **, ***p values < 0.05, 0.001 and 0.0001 significantly discriminate ctrl- from ENO1-MDSC. (B) Lymph node cells collected after 72 h of co-culture were stained and gated for CD4+ (left panels) and CD8+ (right panels) expression. Green peaks represent the non-dividing population, empty peaks indicate the different generations due to the vital dye dilution and the red line is the fitting curve evaluated by the FCSExpress 5 Software. For the analysis, a ratio of 0.5 between each generation was set. Representative results from two independent experiments are shown. (C) Supernatants from lymph node cells and ctrl- or ENO1-MDSC co-cultures were analyzed for the presence of IFNγ, IL-17, Il-10 and TGF-β. Graphs represent the mean ± SEM of values obtained from three independent experiments. *, **, ***p values < 0.05, 0.001 and 0.0001, which significantly discriminate activated T cells alone from those co-cultured with ctrlMDSC and ENO1-MDSC. §, §§p values < 0.05 and 0.001, which significantly discriminate T cells co-cultured with ctrlMDSC from T cells co-cultured with ENO1-MDSC.
Supplemental material

Supplementary Files

Download MS Word (336 KB)

Reprints and Corporate Permissions

Please note: Selecting permissions does not provide access to the full text of the article, please see our help page How do I view content?

To request a reprint or corporate permissions for this article, please click on the relevant link below:

Academic Permissions

Please note: Selecting permissions does not provide access to the full text of the article, please see our help page How do I view content?

Obtain permissions instantly via Rightslink by clicking on the button below:

If you are unable to obtain permissions via Rightslink, please complete and submit this Permissions form. For more information, please visit our Permissions help page.