827
Views
6
CrossRef citations to date
0
Altmetric
Brief Report

Tipping a favorable CNS intratumoral immune response using immune stimulation combined with inhibition of tumor-mediated immune suppression

, , , , , , , , & show all
Article: e1117739 | Received 23 Sep 2015, Accepted 02 Nov 2015, Published online: 19 Apr 2016

Figures & data

Figure 1. The combination of miR-124 with VEGF-4–1BB had an additive therapeutic effect in a genetically-engineered murine model (GEMM) of high-grade glioma. (A). Treatment schema of GEMM mice treated with either miR124, VEGF-4–1BB or the combination of both. (B). Graph of the Kaplan–Meier survival estimate demonstrates improved survival in miR-124 + VEGF-4–1BB-treated Ntv-a mice transfected with the RCAS-PDGFB and RCAS-STAT3 transgenes (n = 10 mice/group) compared with monotherapy (p = 0.04 by log-rank tests). Repeat of this experiment demonstrated similar findings with the combination treatment of VEGF-4–1BB and miRNA-124 resulting in a median survival time of 75.5 d (p = 0.0335 by log-rank test). (C). Treatment schema of GEMM mice treated with various amounts of 4–1BB aptamer versus 4–1BB antibody. (D). Graph of the Kaplan–Meier survival estimate demonstrates improved survival with the 4–1BB aptamer monotherapy, but only at concentrations (8X) equivalent to that of the 4–1BB antibody (n = 9 mice/group) (p = 0.0966 by log-rank tests). Even at optimal dosing, immune stimulation alone never achieved a similar level of therapeutic efficacy as was observed with the combination of immune stimulation and inhibition of tumor-mediated immune suppression.
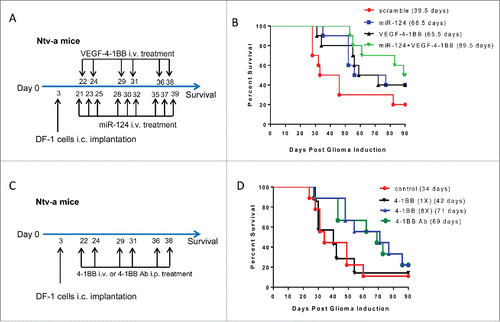
Figure 1. The combination of miR-124 with VEGF-4–1BB had an additive therapeutic effect in a genetically-engineered murine model (GEMM) of high-grade glioma. (A). Treatment schema of GEMM mice treated with either miR124, VEGF-4–1BB or the combination of both. (B). Graph of the Kaplan–Meier survival estimate demonstrates improved survival in miR-124 + VEGF-4–1BB-treated Ntv-a mice transfected with the RCAS-PDGFB and RCAS-STAT3 transgenes (n = 10 mice/group) compared with monotherapy (p = 0.04 by log-rank tests). Repeat of this experiment demonstrated similar findings with the combination treatment of VEGF-4–1BB and miRNA-124 resulting in a median survival time of 75.5 d (p = 0.0335 by log-rank test). (C). Treatment schema of GEMM mice treated with various amounts of 4–1BB aptamer versus 4–1BB antibody. (D). Graph of the Kaplan–Meier survival estimate demonstrates improved survival with the 4–1BB aptamer monotherapy, but only at concentrations (8X) equivalent to that of the 4–1BB antibody (n = 9 mice/group) (p = 0.0966 by log-rank tests). Even at optimal dosing, immune stimulation alone never achieved a similar level of therapeutic efficacy as was observed with the combination of immune stimulation and inhibition of tumor-mediated immune suppression.

Figure 2. Glioma biology in the setting of miR-124 and VEGF-4–1BB treatment. (A). Representative VEGF staining of a high-grade glioma induced in Ntv-a mice transfected with RCAS-PDGFB and RCAS-STAT3 transgenes demonstrates an island of expression (left panel bar scale r = 12.5 μm ; right panel bar scale = 100 μm). Arrows denote localized areas of positive VEGF staining. (B). Summarized analysis of the presence of VEGF in the tumors of mice treated with scramble control (n = 7), miR-124 (n = 9), VEGF-4–1BB (n = 7), or miR-124 + VEGF-4–1BB (n = 9). (C). Summary graph demonstrates the incidence of high- and low-grade gliomas on the basis of hematoxylin and eosin staining features of necrosis and neovascular proliferation in Ntv-a mice transfected with RCAS-PDGFB and RCAS-STAT3 transgenes and subsequently treated with scramble control (n = 9), miR-124 (n = 10), VEGF-4–1BB (n = 10), or the combination of miR-124 + VEGF-4–1BB (n = 10) from .
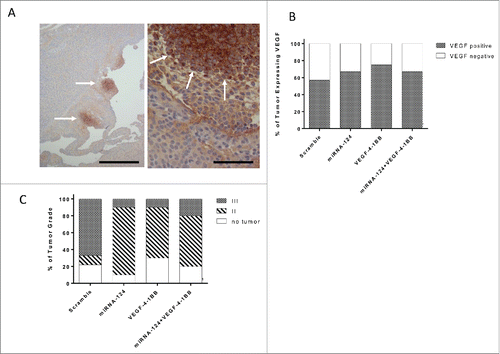
Figure 2. Glioma biology in the setting of miR-124 and VEGF-4–1BB treatment. (A). Representative VEGF staining of a high-grade glioma induced in Ntv-a mice transfected with RCAS-PDGFB and RCAS-STAT3 transgenes demonstrates an island of expression (left panel bar scale r = 12.5 μm ; right panel bar scale = 100 μm). Arrows denote localized areas of positive VEGF staining. (B). Summarized analysis of the presence of VEGF in the tumors of mice treated with scramble control (n = 7), miR-124 (n = 9), VEGF-4–1BB (n = 7), or miR-124 + VEGF-4–1BB (n = 9). (C). Summary graph demonstrates the incidence of high- and low-grade gliomas on the basis of hematoxylin and eosin staining features of necrosis and neovascular proliferation in Ntv-a mice transfected with RCAS-PDGFB and RCAS-STAT3 transgenes and subsequently treated with scramble control (n = 9), miR-124 (n = 10), VEGF-4–1BB (n = 10), or the combination of miR-124 + VEGF-4–1BB (n = 10) from Fig. 1A-B.

Figure 3. Intratumoral immune responses of miR-124 and VEGF-4–1BB treatment. (A). Representative specimen from the brain of an Ntv-a mouse transfected with the RCAS-PDGFB and RCAS-STAT3 transgenes demonstrating F4/80 immune infiltration upon treatment with miR-124 + VEGF-4–1BB versus monotherapy (bar scale = 100 μm). (B). Summary graph of the treatment groups, including scramble control (n = 7), miR-124 (n = 9), VEGF-4–1BB (n = 7), and the combination of miR-124 + VEGF-4–1BB (n = 9); p = 0.0014 by unpaired, two-sided two sample t-tests. (C). Representative specimen from the brain of an Ntv-a mouse transfected with the RCAS-PDGFB and RCAS-STAT3 transgenes demonstrating CD3+ immune infiltration upon treatment with miR-124 + VEGF-4–1BB versus monotherapy (bar scale = 100 μm). (D). Summary graph of the treatment groups including scramble control (n = 6), miR-124 (n = 6), VEGF-4–1BB (n = 5), and the combination of miR-124 + VEGF-4–1BB (n = 5); p = 0.0132 by unpaired, two-sided two sample t-tests.
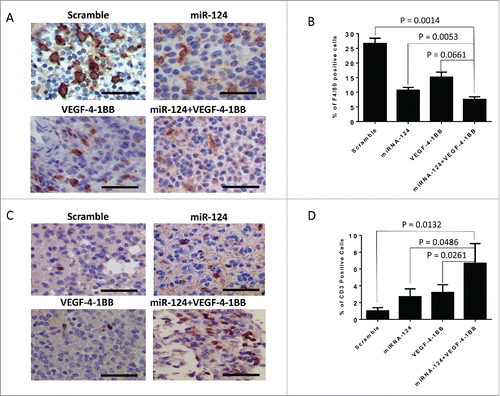
Figure 3. Intratumoral immune responses of miR-124 and VEGF-4–1BB treatment. (A). Representative specimen from the brain of an Ntv-a mouse transfected with the RCAS-PDGFB and RCAS-STAT3 transgenes demonstrating F4/80 immune infiltration upon treatment with miR-124 + VEGF-4–1BB versus monotherapy (bar scale = 100 μm). (B). Summary graph of the treatment groups, including scramble control (n = 7), miR-124 (n = 9), VEGF-4–1BB (n = 7), and the combination of miR-124 + VEGF-4–1BB (n = 9); p = 0.0014 by unpaired, two-sided two sample t-tests. (C). Representative specimen from the brain of an Ntv-a mouse transfected with the RCAS-PDGFB and RCAS-STAT3 transgenes demonstrating CD3+ immune infiltration upon treatment with miR-124 + VEGF-4–1BB versus monotherapy (bar scale = 100 μm). (D). Summary graph of the treatment groups including scramble control (n = 6), miR-124 (n = 6), VEGF-4–1BB (n = 5), and the combination of miR-124 + VEGF-4–1BB (n = 5); p = 0.0132 by unpaired, two-sided two sample t-tests.

Reprints and Corporate Permissions

Please note: Selecting permissions does not provide access to the full text of the article, please see our help page How do I view content?

To request a reprint or corporate permissions for this article, please click on the relevant link below:

Academic Permissions

Please note: Selecting permissions does not provide access to the full text of the article, please see our help page How do I view content?

Obtain permissions instantly via Rightslink by clicking on the button below:

If you are unable to obtain permissions via Rightslink, please complete and submit this Permissions form. For more information, please visit our Permissions help page.