Figures & data
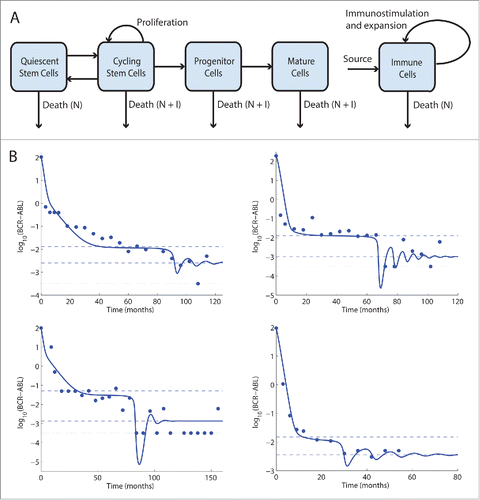
Figure 1. (A) A diagram representing our model of CML and the autologous immune system. Leukemic cells are divided into cycling and quiescent stem cells, progenitors, and mature cells, while there is a single immune cell compartment. Unlabeled arrows indicate transitions of leukemic cells between the compartments. Outgoing arrows indicate cell death, which can occur naturally (N) or as a result of an immune response (I). (B) Four representative fits of our model to patient data. Dots represent patient data, while the thick solid lines are our fits. Dashed lines mark the ends of the immune window. The horizontal dotted lines at y = −3.5 approximate the minimal leukemic concentration that is detectable by quantitative RT-PCR. Dots along this line represent zero measurements.