3,142
Views
58
CrossRef citations to date
0
Altmetric
Original Research

Combined inhibition of TGFβ and PDGF signaling attenuates radiation-induced pulmonary fibrosis

, , , , , , , , , , , , & show all
Article: e1123366 | Received 06 Jul 2015, Accepted 18 Nov 2015, Published online: 11 May 2016

Figures & data

Figure 1. Combined PDGF and TGFβ signaling inhibition improves mouse survival and attenuates weight loss. (A) Schematic depiction of the mouse treatment algorithm up to week 24. (B) Kaplan–Meier curve showing the survival probability of mice treated with radiotherapy (RT) either alone or in combination with galunisertib (LY2157299 monohydrateor LY), imatinib (IM) or SU9518 (SU). Statistical analysis performed by log-rank test. (C) Changes in animal body weight after irradiation and treatment with galunisertib, imatinib or SU9518. Graphs depict mean values +/− SD. Statistical analysis performed by paired Student's t-test; *p < 0.05.
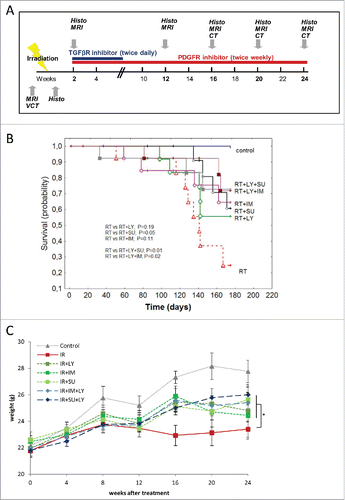
Figure 1. Combined PDGF and TGFβ signaling inhibition improves mouse survival and attenuates weight loss. (A) Schematic depiction of the mouse treatment algorithm up to week 24. (B) Kaplan–Meier curve showing the survival probability of mice treated with radiotherapy (RT) either alone or in combination with galunisertib (LY2157299 monohydrateor LY), imatinib (IM) or SU9518 (SU). Statistical analysis performed by log-rank test. (C) Changes in animal body weight after irradiation and treatment with galunisertib, imatinib or SU9518. Graphs depict mean values +/− SD. Statistical analysis performed by paired Student's t-test; *p < 0.05.

Figure 2. PDGF and TGFβ signaling inhibition reduce radiological signs of pulmonary fibrosis after irradiation. (A) Sample CT images of mouse thoraces at 16, 20 and 24 weeks after irradiation and treatment with galunisertib (LY), imatinib (IM) or SU9518 (SU). Black arrows indicate areas of increased lung density. (B) Quantification of mouse pulmonary density at three different time points after treatment with ionizing radiation and PDGF or TGFβ inhibitors. Average density was measured in Hounsfield units from four standardized regions of interest at the level of the tracheal bifurcation. Graphs depict mean values +/− standard deviation. Statistical analysis was performed by 2-tailed Student's t-test. *p < 0.05; ***p < 0.001. (C) T1-weighted FLASH MRI images of mouse thoraces taken at 16, 20 and 24 weeks after irradiation and treatment with galunisertib (LY), imatinib (IM) or SU9518 (SU).
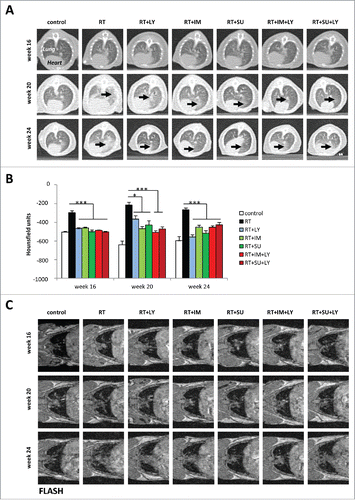
Figure 2. PDGF and TGFβ signaling inhibition reduce radiological signs of pulmonary fibrosis after irradiation. (A) Sample CT images of mouse thoraces at 16, 20 and 24 weeks after irradiation and treatment with galunisertib (LY), imatinib (IM) or SU9518 (SU). Black arrows indicate areas of increased lung density. (B) Quantification of mouse pulmonary density at three different time points after treatment with ionizing radiation and PDGF or TGFβ inhibitors. Average density was measured in Hounsfield units from four standardized regions of interest at the level of the tracheal bifurcation. Graphs depict mean values +/− standard deviation. Statistical analysis was performed by 2-tailed Student's t-test. *p < 0.05; ***p < 0.001. (C) T1-weighted FLASH MRI images of mouse thoraces taken at 16, 20 and 24 weeks after irradiation and treatment with galunisertib (LY), imatinib (IM) or SU9518 (SU).

Figure 3. Combined PDGF and TGFβ signaling inhibition reduce radiation-induced thickening of pulmonary septa and invasion of inflammatory cells. (A) Sample images of treated mouse lungs stained with hematoxylin-eosin, Masson's trichrome and Sirius red. (B) Average thickness of mouse pulmonary septa after irradiation and treatment with galunisertib (LY), imatinib (IM) or SU9518 (SU). (C) Quantification of leukocyte infiltration of irradiated mouse lungs. Graphs depict mean values +/− SD. Statistical analysis was performed by Student's t-test; ***p < 0.001.
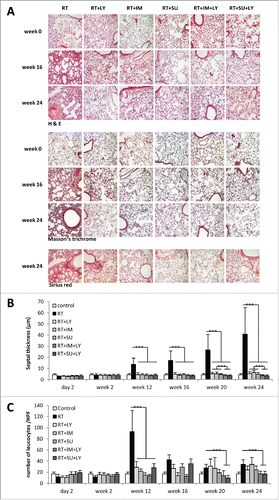
Figure 3. Combined PDGF and TGFβ signaling inhibition reduce radiation-induced thickening of pulmonary septa and invasion of inflammatory cells. (A) Sample images of treated mouse lungs stained with hematoxylin-eosin, Masson's trichrome and Sirius red. (B) Average thickness of mouse pulmonary septa after irradiation and treatment with galunisertib (LY), imatinib (IM) or SU9518 (SU). (C) Quantification of leukocyte infiltration of irradiated mouse lungs. Graphs depict mean values +/− SD. Statistical analysis was performed by Student's t-test; ***p < 0.001.

Figure 4. Gene expression profile of mouse lung tissue treated with ionizing irradiation and PDGF or TGFβ signaling inhibition. (A) Heat map showing the patterns of gene regulation after thoracic irradiation of mice and/or treatment with galunisertib (LY), imatinib (IM) or SU9518 (SU) and combinations. Three main clusters arise from a 1 factor ANOVA analysis: Cluster a groups genes which were mainly activated by the combinatory treatment of PDGFR-inhibitors (Imatinib or Su) with the TGFBR inhibitor galunisertib (LY). Irradiation had only a minor influence. Genes in cluster b were upregulated by radiation and normalized or inhibited by drug treatments which may be associated with their antifibrotic effects including SPP1 (Osteopontin, see B and ). Cluster C contains genes which are mainly activated by the combination of irradiation plus PDGFR-inhibition largely independent of TGFBR inhibition. (B) Relative mRNA expression of genes involved in PDGF and TGFβ signaling. Graphs depict mean values +/− SD. Statistical analysis was performed by Student's t-test; *p < 0.05, **p < 0.01, ***p < 0.001.
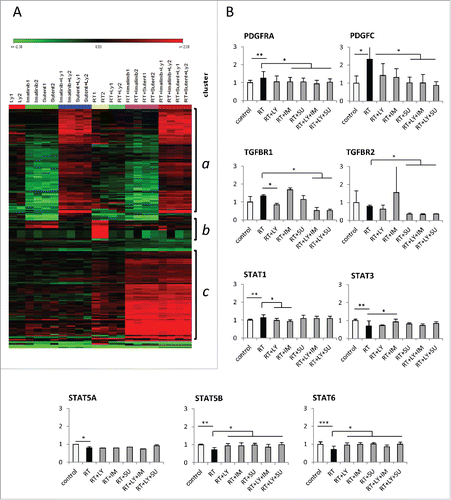
Figure 4. Gene expression profile of mouse lung tissue treated with ionizing irradiation and PDGF or TGFβ signaling inhibition. (A) Heat map showing the patterns of gene regulation after thoracic irradiation of mice and/or treatment with galunisertib (LY), imatinib (IM) or SU9518 (SU) and combinations. Three main clusters arise from a 1 factor ANOVA analysis: Cluster a groups genes which were mainly activated by the combinatory treatment of PDGFR-inhibitors (Imatinib or Su) with the TGFBR inhibitor galunisertib (LY). Irradiation had only a minor influence. Genes in cluster b were upregulated by radiation and normalized or inhibited by drug treatments which may be associated with their antifibrotic effects including SPP1 (Osteopontin, see B and Fig. 5). Cluster C contains genes which are mainly activated by the combination of irradiation plus PDGFR-inhibition largely independent of TGFBR inhibition. (B) Relative mRNA expression of genes involved in PDGF and TGFβ signaling. Graphs depict mean values +/− SD. Statistical analysis was performed by Student's t-test; *p < 0.05, **p < 0.01, ***p < 0.001.

Figure 5. Radiation-induced Osteopontin expression is attenuated by PDGF or TGFβ signaling inhibition. (A) Relative mRNA expression of the SPP1 gene encoding the Osteopontin protein after thoracic irradiation and treatment with galunisertib (LY), imatinib (IM) or SU9518 (SU). Graphs depict mean values +/− SD. (week 24; Student's t-test; *p < 0.05 ). (B) Representative slides showing the time course of Osteopontin (OPN) staining of mouse lungs after radiation treatment and inhibition of PDGF and TGFβ signaling. (C) Quantification of Osteopontin staining in mouse lungs. For assessment of OPN expression, the intensity of cytoplasmic and cell membranous immunostaining was pathologically scored on anordinal scale of 0 (absence), 1+ (weak), 2+ (moderate), and 3+ (strong). Graphs depict mean values +/− standard deviation. (Kruskall–Wallis test; *p < 0.05 RT vs. RT+ monotherapy; **p < 0.05 RT+ monotherapy vs. RT+ dual therapy).
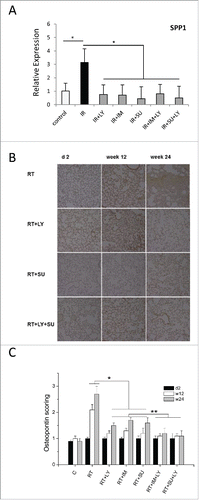
Figure 5. Radiation-induced Osteopontin expression is attenuated by PDGF or TGFβ signaling inhibition. (A) Relative mRNA expression of the SPP1 gene encoding the Osteopontin protein after thoracic irradiation and treatment with galunisertib (LY), imatinib (IM) or SU9518 (SU). Graphs depict mean values +/− SD. (week 24; Student's t-test; *p < 0.05 ). (B) Representative slides showing the time course of Osteopontin (OPN) staining of mouse lungs after radiation treatment and inhibition of PDGF and TGFβ signaling. (C) Quantification of Osteopontin staining in mouse lungs. For assessment of OPN expression, the intensity of cytoplasmic and cell membranous immunostaining was pathologically scored on anordinal scale of 0 (absence), 1+ (weak), 2+ (moderate), and 3+ (strong). Graphs depict mean values +/− standard deviation. (Kruskall–Wallis test; *p < 0.05 RT vs. RT+ monotherapy; **p < 0.05 RT+ monotherapy vs. RT+ dual therapy).
Supplemental material

KONI_A_1123366_supplemental_material.zip

Download Zip (1,017.4 KB)