1,192
Views
17
CrossRef citations to date
0
Altmetric
Original Research

Cell-to-cell distances between tumor-infiltrating inflammatory cells have the potential to distinguish functionally active from suppressed inflammatory cells

, , , , , & show all
Article: e1127494 | Received 07 Oct 2015, Accepted 25 Nov 2015, Published online: 29 Apr 2016

Figures & data

Figure 1. Tissue microarrays and immunohistochemistry. Biopsy specimens were processed into tissue microarrays using a core diameter of 1.6 mm. Tissue microarray tumor punches (A) were stained for FoxP3+ (red nucleic staining) and CD8+ (blue predominantly membranous staining) as shown in (B). (C) Kaplan–Meier plots for overall survival and no evidence of disease over the whole patients collective. (D) Schematic view on the counting strategy used with the image analysis system. The shortest distance to the next cell was calculated from cell type I to cell type I (dashed line) and from cell type I to cell type II and vice versa (continuous line). Only the cells marked with an arrow were calculated in reference to the other cell. Cells in stromal or intraepithelial compartment were analyzed separately.
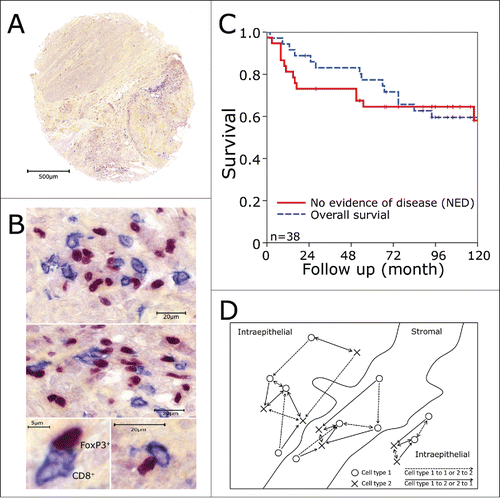
Figure 1. Tissue microarrays and immunohistochemistry. Biopsy specimens were processed into tissue microarrays using a core diameter of 1.6 mm. Tissue microarray tumor punches (A) were stained for FoxP3+ (red nucleic staining) and CD8+ (blue predominantly membranous staining) as shown in (B). (C) Kaplan–Meier plots for overall survival and no evidence of disease over the whole patients collective. (D) Schematic view on the counting strategy used with the image analysis system. The shortest distance to the next cell was calculated from cell type I to cell type I (dashed line) and from cell type I to cell type II and vice versa (continuous line). Only the cells marked with an arrow were calculated in reference to the other cell. Cells in stromal or intraepithelial compartment were analyzed separately.

Figure 2. Frequency of inflammatory cells and their cell-to-cell distances. Mean values of infiltrating cells in the stromal and intraepithelial compartment. The counts are given per mm2. The numbers on top of the graph give the patients included in the analysis (A). The ratio between FoxP3+ cells and the other cell subsets are displayed (B) and the ratio of the different subsets between intraepithelial and stromal compartment (C). The distances between same cell subsets including FoxP3+ cells (D) and FoxP3+ and the different cell subsets in the intraepithelial (E) and stromal compartment (F) are shown. The distances from FoxP3+ to the other cell subsets and from the other cell subset to FoxP3+ was calculated separately (E, F). The significance values are marked by square brackets and the p value is given on top of it.
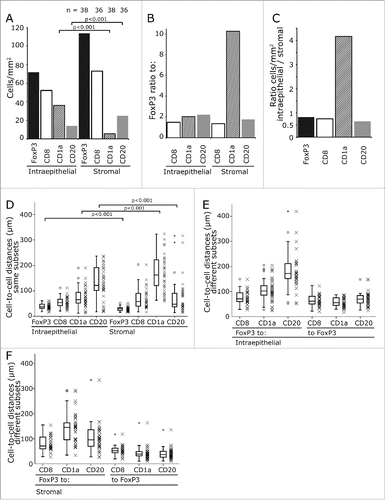
Figure 2. Frequency of inflammatory cells and their cell-to-cell distances. Mean values of infiltrating cells in the stromal and intraepithelial compartment. The counts are given per mm2. The numbers on top of the graph give the patients included in the analysis (A). The ratio between FoxP3+ cells and the other cell subsets are displayed (B) and the ratio of the different subsets between intraepithelial and stromal compartment (C). The distances between same cell subsets including FoxP3+ cells (D) and FoxP3+ and the different cell subsets in the intraepithelial (E) and stromal compartment (F) are shown. The distances from FoxP3+ to the other cell subsets and from the other cell subset to FoxP3+ was calculated separately (E, F). The significance values are marked by square brackets and the p value is given on top of it.

Figure 3. Inflammatory cell-to-cell distances in comparison to inflammatory cell numbers per area. CD1a+-to-CD1a+ distances (A), CD20+-to-CD20+ distances (B), CD8+-to-CD8+ distances (C) and FoxP3+-to-FoxP3+ distances (D) were compared to the numbers of corresponding cells per square mm2. The solid line in the middle of the gray region is the simulated cell-to-cell distance derived from randomly distributed cells. The black lines delimiting the gray region are the 5% and 95% confidential interval of 200 simulation repetitions. The values were fitted by Equationequation 3. Solid red lines represent intraepithelial inflammatory cells and the dashed blue lines the stromal inflammatory cells. Data sets which could not be fitted by Equationequation 3 were fitted by a linear regression. NED survival rates in relation to the intraepithelial (E) and stromal (F) numbers of FoxP3+ cells per mm2. NED survival rates in dependence of the shortest distance between FoxP3+-to-FoxP3+ (G) in the intraepithelial compartment.
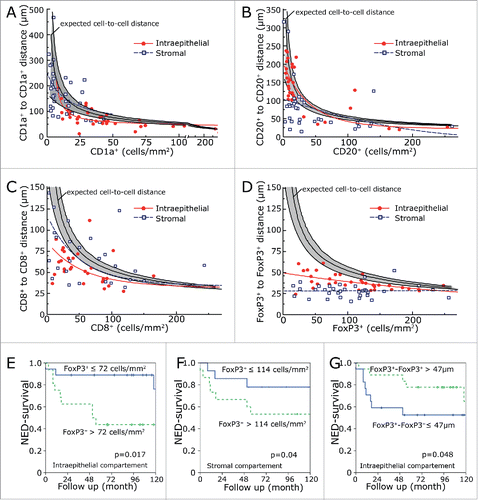
Figure 3. Inflammatory cell-to-cell distances in comparison to inflammatory cell numbers per area. CD1a+-to-CD1a+ distances (A), CD20+-to-CD20+ distances (B), CD8+-to-CD8+ distances (C) and FoxP3+-to-FoxP3+ distances (D) were compared to the numbers of corresponding cells per square mm2. The solid line in the middle of the gray region is the simulated cell-to-cell distance derived from randomly distributed cells. The black lines delimiting the gray region are the 5% and 95% confidential interval of 200 simulation repetitions. The values were fitted by Equationequation 3Equation 3:Cell–to–cell distance p0/n+p1+p2. Solid red lines represent intraepithelial inflammatory cells and the dashed blue lines the stromal inflammatory cells. Data sets which could not be fitted by Equationequation 3Equation 3:Cell–to–cell distance p0/n+p1+p2 were fitted by a linear regression. NED survival rates in relation to the intraepithelial (E) and stromal (F) numbers of FoxP3+ cells per mm2. NED survival rates in dependence of the shortest distance between FoxP3+-to-FoxP3+ (G) in the intraepithelial compartment.

Table 1. Average frequency of inflammatory FoxP3+, CD1a+, CD20+ and CD8+ cells in the intraepithelial and stromal areas and simulated (expected) and observed distances between the lymphocytes.

Figure 4. NED survival rates in dependence of the shortest distance between stromal CD1a +-to-CD1a+ cells (A) and distances between intraepithelial CD20+-to-FoxP3+ (B) and FoxP3+-to-CD20+ (C) cells. Correlation of FoxP3+ and CD8+ cells numbers in the intraepithelial and stromal compartment (D). Interrelations within the intraepithelial and stromal regions and between the two regions for frequency of cells (E) and cell-to-cell distance (F). The double-headed arrows indicate a significance level of p < 0.001.
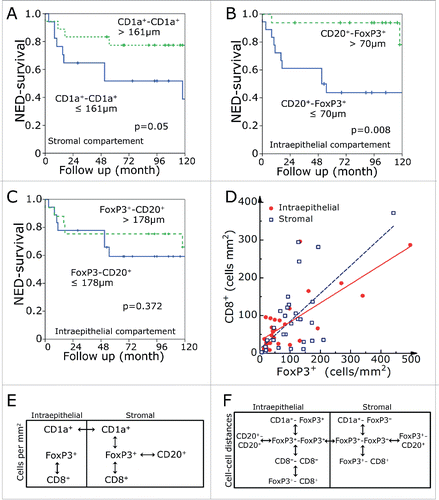
Figure 4. NED survival rates in dependence of the shortest distance between stromal CD1a +-to-CD1a+ cells (A) and distances between intraepithelial CD20+-to-FoxP3+ (B) and FoxP3+-to-CD20+ (C) cells. Correlation of FoxP3+ and CD8+ cells numbers in the intraepithelial and stromal compartment (D). Interrelations within the intraepithelial and stromal regions and between the two regions for frequency of cells (E) and cell-to-cell distance (F). The double-headed arrows indicate a significance level of p < 0.001.
Supplemental material

KONI_A_1127494_supplemental_material.xls

Download MS Excel (132.8 KB)

Reprints and Corporate Permissions

Please note: Selecting permissions does not provide access to the full text of the article, please see our help page How do I view content?

To request a reprint or corporate permissions for this article, please click on the relevant link below:

Academic Permissions

Please note: Selecting permissions does not provide access to the full text of the article, please see our help page How do I view content?

Obtain permissions instantly via Rightslink by clicking on the button below:

If you are unable to obtain permissions via Rightslink, please complete and submit this Permissions form. For more information, please visit our Permissions help page.