
Figures & data
Table 1. Patients characteristics.
Figure 1. Association between cervical histopathology status and increased cervical cell density per square millimeter in ART-treated HIV+/HPV+ women. Immunohistochemical staining for CD4+, CD8+, CD68 and CD11c is shown in epithelium and stroma from cervical biopsies of representative women in each group: HR (-) HPV with negative cervical histopathology (group 1, study subject TJA1019081, top panel), HR (+) HPV with negative cervical histopathology (group 2, study subject TJA1040434, middle panel), and HR (+) HPV with CIN1 or CIN2/3 (group 3, study subject TJA1104317, bottom panel).
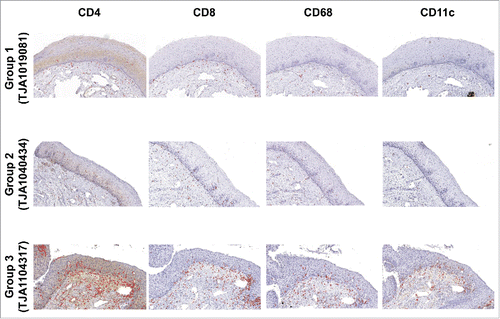
Table 2. Differences in cervical cell density per square millimeter amongst study groups.
Figure 2. Association between HR HPV and systemic T cell activation and Tregs cell subsets. CD3+CD8+CD38+ percentages (%) of lymphocytes (top panel) and CD4+CD25+FoxP3+ (Tregs) % of lymphocytes (bottom panel) are shown for women in groups 1, 2 and 3. Data are shown as interquartile box plots with median and outliers for each group, and significant (<0.05) p values.
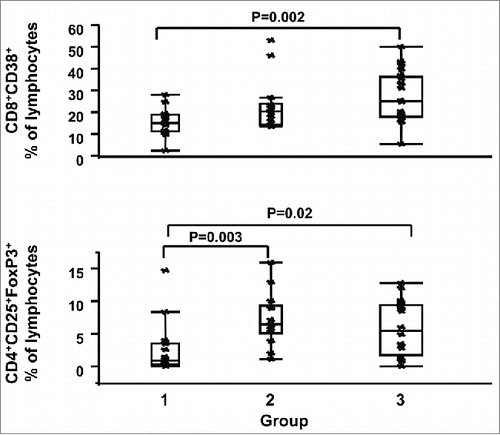
Figure 3. Association between HR HPV and systemic immune exhaustion. Left panel shows CD3+CD8+PD1+ (top), CD3+CD8+PD1-CTLA-4+ (middle), and CD3+CD8+BTLA+CD160+ (bottom) % of lymphocytes, while right panel shows Lin2-HLA-DR+CD11c+PDL1+PDL2+ (top), Lin2-HLA-DR+CD11c+CD86+CD40+ (middle), and Lin2-HLA-DR+CD11c+HVEM+ (bottom) % of live cells for women in groups 1, 2 and 3. Data are shown as interquartile box plots with median and outliers for each group, and significant (<0.05) p values.
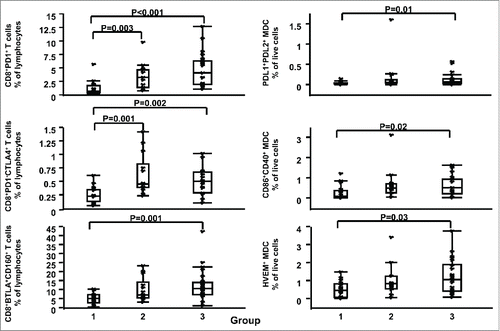
Table 3. Significant differences in immune variables amongst study groups.
Table 4. Significant correlations with CD4+ T cell count.
Figure 4. Association between systemic CD8+ T cell activation and systemic immune activation/exhaustion. (A) Correlation between MFI of CD38 on CD3+CD8+ T cells and systemic immune activation/exhaustion [MFI HVEM on Lin2-HLA-DR+CD11c+ (top left), and MFI HVEM on Lin2-HLA-DR+CD123hi (top right)] in women with HR HPV (group 2 + 3); (B) Correlation between CD3+CD8+CD38+ % of lymphocytes and systemic immune activation/exhaustion [CD3+CD8+PD1+ (bottom left), and CD3+CD8+BTLA+ (bottom right) % of lymphocytes] in women with HR HPV (group 2+3). Data are shown as regression lines, with number of subjects (n), correlation and p values.
![Figure 4. Association between systemic CD8+ T cell activation and systemic immune activation/exhaustion. (A) Correlation between MFI of CD38 on CD3+CD8+ T cells and systemic immune activation/exhaustion [MFI HVEM on Lin2-HLA-DR+CD11c+ (top left), and MFI HVEM on Lin2-HLA-DR+CD123hi (top right)] in women with HR HPV (group 2 + 3); (B) Correlation between CD3+CD8+CD38+ % of lymphocytes and systemic immune activation/exhaustion [CD3+CD8+PD1+ (bottom left), and CD3+CD8+BTLA+ (bottom right) % of lymphocytes] in women with HR HPV (group 2+3). Data are shown as regression lines, with number of subjects (n), correlation and p values.](/cms/asset/75d50638-d827-44ac-acb6-bf2d3bf042a4/koni_a_1128612_f0004_b.gif)
Table 5. Significant correlations with CD8+ T cell activation.