Figures & data
Figure 1. Correlation of phosphorylated STAT3 with MDSC and TAM markers in human head neck squamous cell carcinoma. (A) Representative immunohistochemical staining of p-STAT3Tyr705, CD68, CD163, CD33 and CD11b in HNSCC tissue. Scale bar, 50 μm. (B, C) The expression of p-STAT3Tyr705 was significantly correlated with CD68 (p < 0.01, r = 0.2561), CD163 (p < 0.05, r = 0.1903), CD11b (p < 0.01, r = 0.2500) and CD33 (p < 0.05, r = 0.1914) in human HNSCC by analyzing the tissue microarray immunohistochemical staining. Statistical analysis including normal mucosa (n = 32) and head neck squamous cell carcinoma (HNSCC, n = 86). (D) Hierarchical clustering reveals close relation of p-STAT3Tyr705, CD68, CD163, CD11b and CD33 in human HNSCC, mucosa (n = 32, Cluster 3), dysplasia (n = 12, cluster 2) and HNSCC (n = 86, cluster 1).
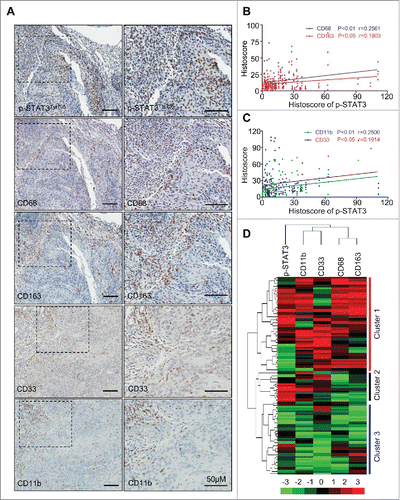
Figure 2. STAT3 Phosphorylation in Tgfbr1 cKO mice, Pten cKO mice and Tgfbr1/Pten 2cKO mice. (A) Representative immunohistochemical staining of p-STAT3Tyr705 in wide type (WT) tongue, Tgfbr1/Pten 2cKO tongue and Tgfbr1/Pten 2cKO tongue squamous cell carcinoma (TSCC). Scale bar, 50 μm. (B) Hematoxyline-eosin staining and immunohistochemically staining indicate increase p-STAT3Tyr705 expression in Pten conditional knock out (Pten cKO) mice HNSCC, Tgfbr1 conditional knock out (Tgfbr1 cKO) mice HNSCC and Tgfbr1/Pten 2cKO mice HNSCC, Scale bars,100 μm. (C) Western blot shows a significant increase in p-STAT3Tyr705 in Tgfbr1/Pten 2cKO mice TSCC as compared with wide type and Tgfbr1/Pten 2cKO tongue mucosa. (D) Western blot shows a significant increase in p-STAT3Tyr705 in Pten cKO mice HNSCC, Tgfbr1 cKO mice HNSCC and Tgfbr1/Pten 2cKO mice HNSCC. (E) Representative double immunofluorescence staining of CD11b/p-STAT3 in Tgfbr1/Pten 2cKO mice HNSCC. Scale bar, 50 μm. (F) Representative double immunofluorescence staining of CD11c/p-STAT3 in Tgfbr1/Pten 2cKO mice HNSCC. Scale bar, 50 μm.
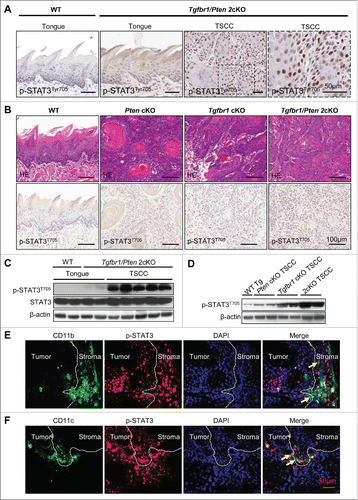
Figure 3. S3I-201-induced STAT3 signaling inhibition delays tumorigenesis in Tgfbr1/Pten 2cKO mice. (A) Tgfbr1/Pten 2cKO mice bearing carcinoma were treated with S3I-201 intraperitoneal (i.p) every other day for 4 weeks or PBS treated (n = 6 mice respectively). (B) Representative photos of mice tumor with external head and neck cancer after treatment with S3I-201 or PBS in day 35 and day 42 after the first dose of tamoxifen gavage are shown. (C) Representative tongue squamous cell carcinoma photos after treatment with S3I-201 or PBS in day 35 and day 42 after the first dose of tamoxifen gavage (Arrow). (D) Total tumor volume were assessed in S3I-201 and control group once a week after tamoxifen gavage (unpaired Student t test, ***p <0.001). (E) The number of tumor and the volume of each tumor were measured after treatment with S3I-201 or PBS in day 35 and day 42 after the first dose of tamoxifen gavage. (F) Drug toxicity was assessed by body weight of Tgfbr1/Pten 2cKO mice in each group. (G) Immunohistochemical staining indicated increased p-STAT3Tyr705 expression in Tgfbr1/Pten 2cKO mice compared with S3I-201 treatment group.
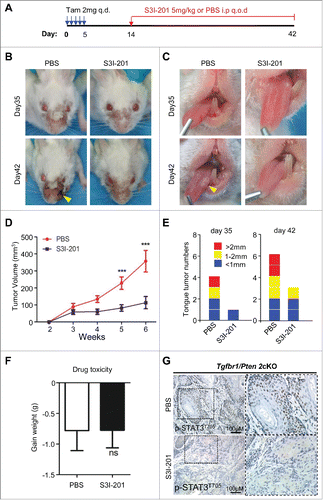
Figure 4. The population of MDSCs was decreased in S3I-201 treatment Tgfbr1/Pten 2cKO mice. (A) Representative flow cytometry profiles showed increased CD11b+Gr1+ cells in spleen of HNSCC bearing Tgfbr1/Pten 2cKO mouse (PBS treatment, middle) as compared with wide type (WT) mice. CD11b+Gr1+ cell population was significantly decreased after SI-201 treatment (right). (B) Quantification of the percent of CD11b+Gr1+ MDSCs in spleen, lymph nodes and blood of mice with or without S3I-201 treatment and wild type mice (Data presented as mean ± SEM, n = 6 mice respectively, ANOVA with post Tukey test. *p <0.05; **p <0.01; ***p <0.001). (C) Representative flow cytometry profiles shows CD11b+Gr1+ cell population in tumor was significantly decreased after S3I-201 treatment. (D) Quantification the percent of CD11b+Gr1+ MDSCs in tumor of mice with or without S3I-201 treatment and wide type mice (Data presented as mean ± SEM, n = 6 mice respectively, ANOVA with post Tukey test. **p <0.01). (E) Double immunofluorescence staining of CD11b+ Gr1+ cell population was performed in mice HNSCC with or without S3I-201 treatment. Scale bar, 50 μm. (F) Western blot analysis revealed that the protein level of p-STAT3 and CXCL1 were reduced with selective STAT3 activity inhibition.
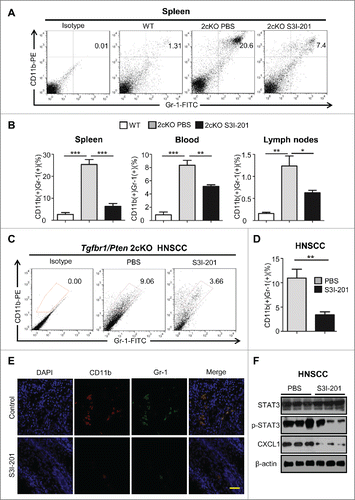
Figure 5. The population of TAMs was decreased in S3I-201 treatment Tgfbr1/Pten 2cKO mice. (A) Single cell suspension from spleen of HNSCC bearing mouse treated with S3I-201 or PBS and wide type mice were stained with anti-CD11b and anti-F4/80 antibody and the percentage of positive cells analyzed by flow cytometry, representative images are shown. (B) Quantification of CD11b+F4/80+ TAMs in spleen, lymph nodes and blood of mice with or without S3I-201 treatment and wild type mice (Data presented as mean ± SEM, n = 6 mice respectively, ANOVA with post Tukey test. *p <0.05; **p <0.01). (C) Single cell suspension from tumor of HNSCC bearing mouse treated with S3I-201 or PBS and wide type mice were stained with anti-CD11b and anti-F4/80 antibody and percentage of positive cells analyzed by flow cytometry, representative images are shown. (D) Quantification of CD11b+F4/80+ TAMs in tumor of mice with or without S3I-201 treatment and wide type mice (Data presented as mean ± SEM, n = 6 mice respectively, ANOVA with post Tukey test. **p <0.01). (E) Double immunofluorescence images of CD47 and SIRPα in mice bearing tumor with or without S3I-201 treatment are shown. Scale bar, 50 μm. (F) Western blot analysis revealed that the protein level of CD47 and SIRPα were reduced with STAT3 activity inhibition.
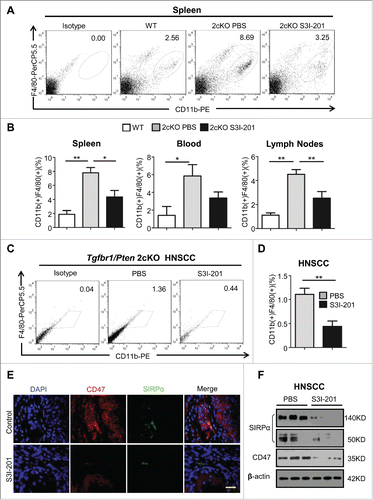
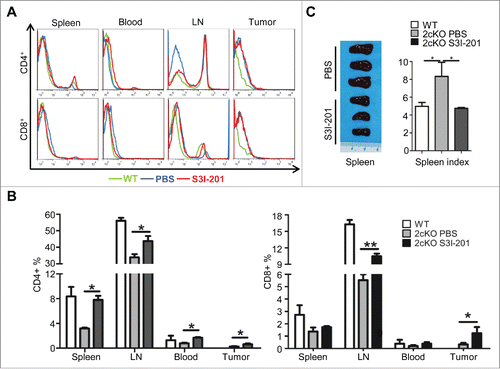
Figure 6. Increase of effective T cells and reduction of exhausted T-cells in S3I-201 treatment Tgfbr1/Pten 2cKO mice. (A) Representative flow cytometry photos showed increase of CD4+ and CD8+ T cells in S3I-201 treatment group. (B) Quantification of CD4+ and CD8+cell population in spleen, lymph node (LN), blood and tumor of wild type mice, Tgfbr1/Pten conditional knock out (Tgfbr1/Pten 2cKO) mice with or without S3I-201 treatment (Data presented as mean ± SEM, n = 6 mice respectively, ANOVA with post Tukey test. *p <0.05; **p <0.01). (C) Representative image and spleen index shows the comparison between S3I-201 treatment group and control group (Data presented as mean ± SEM, n = 3 mice respectively, ANOVA with post Tukey test. *p <0.05).