Figures & data
Figure 1. Construction and evaluation of the TR1-IgMs. (A) Western blot analysis of the recombinant purified TR1-IgMs. Ten nanograms of each of the biotinylated-TR1-IgM(+/−)s (TR1-IgM(J+/−)-401, 404, 419, 422, and 438) and control-IgM(+/−) was immunoblotted with horseradish peroxidase-conjugated streptavidin. (B) Reactivity of the TR1-IgM(J+)s with the recombinant human TRAIL-R family. The binding of the TR1-IgM(J+)s to human TRAIL-R1-Fc, TRAIL-R2-Fc, TRAIL-R3-Fc, TRAIL-R4-Fc, or OPG was examined by ELISA. Control-IgM(J+) was used as a control. The data are shown as the mean ± SD of triplicate cultures. (C) The binding of the TR1-IgM(J+)s to the Colo205 cell line was analyzed by flow cytometry. The cells were stained with 5 μg/mL of biotinylated-TR1-IgM(J+)s and control-IgM(J+) as indicated, followed by R-PE-conjugated streptavidin, and analyzed with flow cytometry. X-axis, fluorescence intensity of PE; Y-axis, relative cell number. Representative data of three independent experiments in which similar results were obtained are shown.
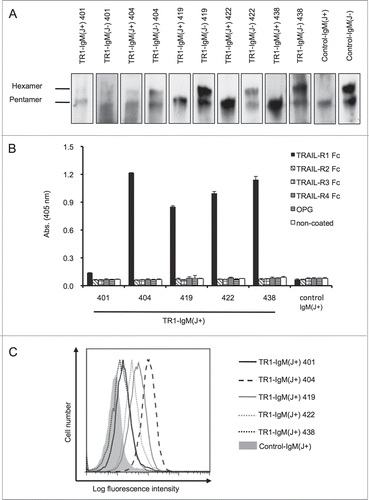
Figure 2. TR1-IgMs induce tumor cell killing by apoptotic signaling. (A) Cell viability assay. Colo205 cells were incubated with the indicated antibodies for 24 h, and cell viability was measured. (B) Measurement of activated caspases. The cells were incubated with the indicated concentrations of TR1-IgM(J+)s or control-IgM(J+). Activated caspase-8, and -3/7 were measured after 3 and 6 h of culture, respectively. (C) Caspase-dependent cell death in Colo205 cells. The cells were incubated with or without the indicated concentrations of z-VAD-fmk for 4 h. Then, the cells were cultured with TR1-IgMs or control-IgM for 24 h. After cell culture, the cell viability was determined. The data are shown as the mean ± SD of triplicate cultures. *p < 0.05 by Student’s t-test.
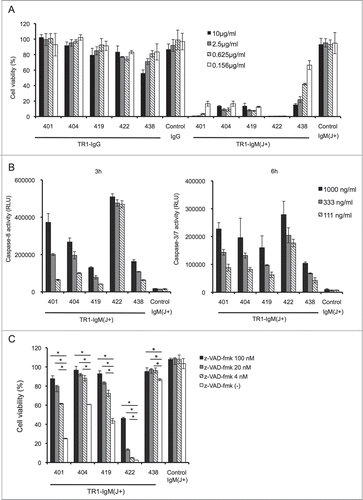
Table 1. EC50 values of the TR1-IgM(J+)s
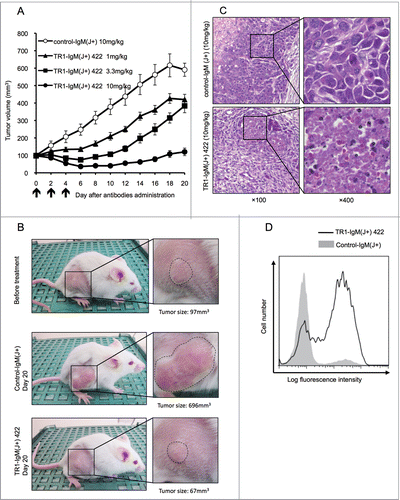
Figure 3. Antitumor efficacy of TR1-IgMs on Colo205 cell-derived mouse xenograft tumors in vivo. (A) The tumor growth curves of each group of tumor-bearing mice. SCID mice (10 per group) bearing Colo205 xenograft tumors were i.v. injected with TR1-IgM(J+) 422 or control-IgM(J+) on the indicated days (arrows). Each time point represents the mean value (±S .E.M.) of the tumor sizes within the treated group on the day of measurement. (B) Representative photographs of the Colo205 tumor-bearing mice in each group on day 0 or day 20 after treatment. The magnified photo shows that the tumors (within dotted lines) in the TR1-IgM(J+) 422 (10mg/kg)-treated mice were notably reduced compared with the tumors in the control-IgM(J+) (10mg/kg)-treated mice. (C) Representative photomicrographs of hematoxylin and eosin staining of the tumor tissues from each group of mice at 2 d post-treatment. Expanded views of the region marked with black boxes are shown (right). Original magnification, ×100 (left), ×400 (right). (D) Caspase-3 activation following the injection of TR1-IgM(J+) 422. SCID mice that had pre-established Colo205 tumor xenografts were injected with a single dose (10 mg/kg body weight) of TR1-IgM(J+) 422 (solid line) or control-IgM (shaded peak). The tumors were then excised 4 h after injection, and activated caspase-3 induction was analyzed by flow cytometry. X-axis; fluorescence intensity of fluorescein isothiocyanate (FITC), Y-axis; relative cell number.