3,627
Views
154
CrossRef citations to date
0
Altmetric
Original Research

Priming of neutrophils toward NETosis promotes tumor growth

, , , , , & show all
Article: e1134073 | Received 14 Sep 2015, Accepted 14 Dec 2015, Published online: 04 May 2016

Figures & data

Figure 1. PAD4-deficiency with impaired NETosis reduces LLC tumor growth. LLC cells were injected in 17 WT or 16 PAD4−/− mice and tumors were allowed to grow. (A) Tumor growth was evaluated until day 17 post-implantation, unless mice were moribund or tumors necrotic and mice were sacrificed. A reduction in tumor size and weight was observed in PAD4−/− compared to WT mice. *p <0.05 (B) Confocal analysis of tumor sections revealed the presence of NETs in tumors from WT mice, as identified by extracellular citrullinated histone H3 (H3Cit) and diffused DNA staining (arrows), which was absent in the tumors from PAD4−/− hosts. (C) Western blot analysis of tumor lysates obtained on indicated days post-implantation showed neutrophil accumulation in both genotypes and increasing H3Cit content only in the tumors from WT mice as the tumors progressed. At day 17 post-implantation, a similar amount of Ly6G was observed in the tumor lysate of both genotypes (n = 4–6; p >0.05). (D) FACS analysis of digested tumors also revealed a similar amount of neutrophils in both genotypes (n = 4).
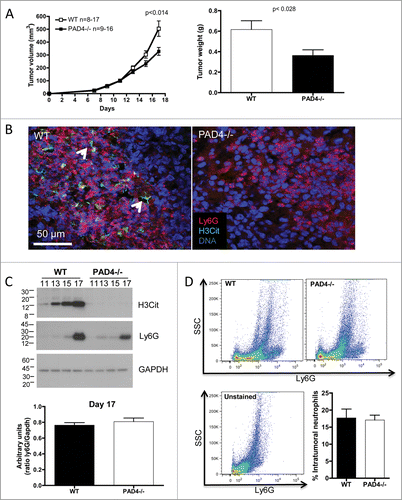
Figure 1. PAD4-deficiency with impaired NETosis reduces LLC tumor growth. LLC cells were injected in 17 WT or 16 PAD4−/− mice and tumors were allowed to grow. (A) Tumor growth was evaluated until day 17 post-implantation, unless mice were moribund or tumors necrotic and mice were sacrificed. A reduction in tumor size and weight was observed in PAD4−/− compared to WT mice. *p <0.05 (B) Confocal analysis of tumor sections revealed the presence of NETs in tumors from WT mice, as identified by extracellular citrullinated histone H3 (H3Cit) and diffused DNA staining (arrows), which was absent in the tumors from PAD4−/− hosts. (C) Western blot analysis of tumor lysates obtained on indicated days post-implantation showed neutrophil accumulation in both genotypes and increasing H3Cit content only in the tumors from WT mice as the tumors progressed. At day 17 post-implantation, a similar amount of Ly6G was observed in the tumor lysate of both genotypes (n = 4–6; p >0.05). (D) FACS analysis of digested tumors also revealed a similar amount of neutrophils in both genotypes (n = 4).

Figure 2. Host PAD4-deficiency does not affect the growth of B16 melanoma. B16F10 cells were injected in 20 WT and 22 PAD4−/− mice and tumors were allowed to grow. (A) Tumor growth was evaluated until day 17 post-implantation, unless mice were moribund or tumors necrotic and mice were sacrificed. No difference in tumor growth was observed between the genotypes (p >0.05). (B) Confocal analysis of tumor sections revealed only rare NETs in tumors from WT mice (arrow), as observed by extracellular H3Cit, which was absent in the tumor from PAD4−/− hosts. (C) At day 17 post-implantation, LLC and B16 tumors in WT animals reached similar weights. Comparative analysis of their lysates by Western blot showed similar neutrophil infiltration (n = 4) but a much higher amount of H3Cit in the LLC tumors than in the B16 tumors. (D) B16F10 and LLC cells were assessed for PAD4 expression by RT-PCR. B16 cells showed higher expression of PAD4. (E) Western blot analysis of 17-d tumors from PAD4-deficient mice showed H3Cit expression in B16 tumors whereas no H3Cit can be observed in LLC tumors.
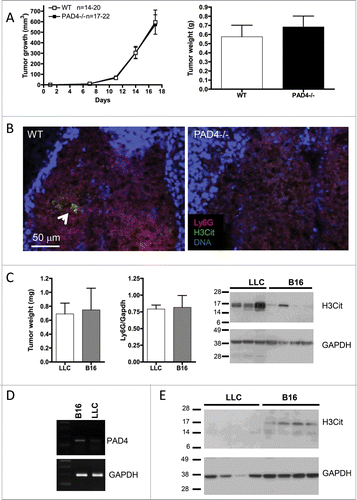
Figure 2. Host PAD4-deficiency does not affect the growth of B16 melanoma. B16F10 cells were injected in 20 WT and 22 PAD4−/− mice and tumors were allowed to grow. (A) Tumor growth was evaluated until day 17 post-implantation, unless mice were moribund or tumors necrotic and mice were sacrificed. No difference in tumor growth was observed between the genotypes (p >0.05). (B) Confocal analysis of tumor sections revealed only rare NETs in tumors from WT mice (arrow), as observed by extracellular H3Cit, which was absent in the tumor from PAD4−/− hosts. (C) At day 17 post-implantation, LLC and B16 tumors in WT animals reached similar weights. Comparative analysis of their lysates by Western blot showed similar neutrophil infiltration (n = 4) but a much higher amount of H3Cit in the LLC tumors than in the B16 tumors. (D) B16F10 and LLC cells were assessed for PAD4 expression by RT-PCR. B16 cells showed higher expression of PAD4. (E) Western blot analysis of 17-d tumors from PAD4-deficient mice showed H3Cit expression in B16 tumors whereas no H3Cit can be observed in LLC tumors.

Figure 3. Neutrophils from LLC and B16 tumor-bearing WT mice have a different phenotype. LLC or B16F10 cells were injected and tumors were allowed to grow. (A) At day 17 post-implantation, tumors were digested for FACS analysis. CD11b and Ly6G staining revealed a different phenotype of the tumor-infiltrating neutrophils with more CD11bhigh neutrophils in the LLC tumors (n = 6). (B) Plasma analysis showed upregulation of G-CSF levels in LLC tumor-bearing mice, both WT and PAD4−/−, as the tumor grew whereas G-CSF levels remained low in all B16 tumor-bearing mice (n = 4–9). (C) At day 16 and 17 post-implantation, neutrophils from LLC and B16 tumor-bearing WT mice were isolated. Wright–Giemsa staining revealed a typical neutrophil nuclear morphology in mice bearing both type of tumors (left). However, more neutrophils isolated from LLC tumor-bearing mice produced NETs compared to neutrophils isolated from B16 tumor-bearing mice, under both unstimulated and LPS-stimulated conditions (right, n = 4;* p <0.05,**p <0.01).
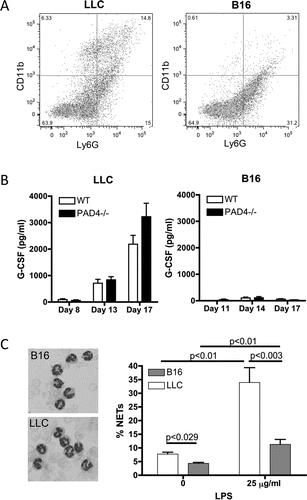
Figure 3. Neutrophils from LLC and B16 tumor-bearing WT mice have a different phenotype. LLC or B16F10 cells were injected and tumors were allowed to grow. (A) At day 17 post-implantation, tumors were digested for FACS analysis. CD11b and Ly6G staining revealed a different phenotype of the tumor-infiltrating neutrophils with more CD11bhigh neutrophils in the LLC tumors (n = 6). (B) Plasma analysis showed upregulation of G-CSF levels in LLC tumor-bearing mice, both WT and PAD4−/−, as the tumor grew whereas G-CSF levels remained low in all B16 tumor-bearing mice (n = 4–9). (C) At day 16 and 17 post-implantation, neutrophils from LLC and B16 tumor-bearing WT mice were isolated. Wright–Giemsa staining revealed a typical neutrophil nuclear morphology in mice bearing both type of tumors (left). However, more neutrophils isolated from LLC tumor-bearing mice produced NETs compared to neutrophils isolated from B16 tumor-bearing mice, under both unstimulated and LPS-stimulated conditions (right, n = 4;* p <0.05,**p <0.01).

Figure 4. G-CSF treatment induces intratumoral accumulation of NETing neutrophils and promotes B16 tumor growth in WT but not PAD4−/− mice. B16F10 cells were injected in 11 WT and 12 PAD4−/− mice and tumors were allowed to grow. At day 9 post-implantation, when tumors reached 30–50 mm3, daily G-CSF treatment was initiated and tumor growth was monitored. Tumor growth was evaluated until day 17 post-implantation, unless mice were moribund or tumors necrotic and mice were sacrificed. (A) G-CSF treatment of B16 tumor-bearing mice increases tumor growth in WT mice compared to PAD4−/− mice. As the initial volume of the tumors at the beginning of the treatment varies, data are presented as the ratio of the tumor volume at the indicated day (V1) compared to the volume at the initiation of G-CSF treatment (V0). The curves are compared by a non-linear regression analysis (p = 0.008).  Neutrophil counts were increased by G-CSF treatment but no significant difference in the number of circulating neutrophils was observed between both genotypes (n = 9–10). (B) FACS analysis of the 17-d digested tumors from WT mice showed an increased percentage of CD11bhigh neutrophils in the B16 tumors when the tumor-bearing WT mice were treated with G-CSF. This percentage was similar to that seen in LLC tumors from untreated mice (n = 5–6). (C) Western blot showed increased H3Cit in 17-d tumor lysate of B16 tumors from WT mice treated with G-CSF than from untreated mice (left) whereas this was not observed in PAD4−/− mice (right). (D) Confocal microscopy confirmed the presence of higher amounts of H3Cit and NETs in the B16 tumors from WT mice treated with G-CSF that was absent in B16 tumors from PAD4−/− mice similarly treated.
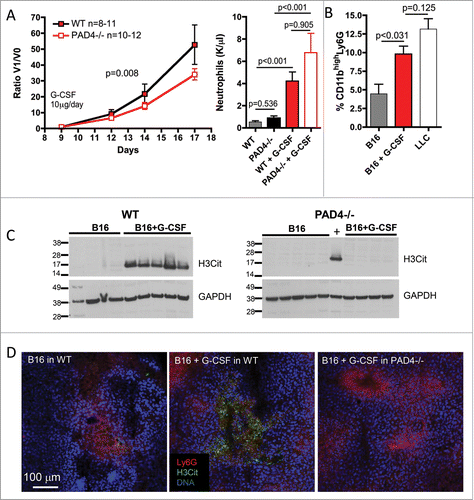
Figure 4. G-CSF treatment induces intratumoral accumulation of NETing neutrophils and promotes B16 tumor growth in WT but not PAD4−/− mice. B16F10 cells were injected in 11 WT and 12 PAD4−/− mice and tumors were allowed to grow. At day 9 post-implantation, when tumors reached 30–50 mm3, daily G-CSF treatment was initiated and tumor growth was monitored. Tumor growth was evaluated until day 17 post-implantation, unless mice were moribund or tumors necrotic and mice were sacrificed. (A) G-CSF treatment of B16 tumor-bearing mice increases tumor growth in WT mice compared to PAD4−/− mice. As the initial volume of the tumors at the beginning of the treatment varies, data are presented as the ratio of the tumor volume at the indicated day (V1) compared to the volume at the initiation of G-CSF treatment (V0). The curves are compared by a non-linear regression analysis (p = 0.008).  Neutrophil counts were increased by G-CSF treatment but no significant difference in the number of circulating neutrophils was observed between both genotypes (n = 9–10). (B) FACS analysis of the 17-d digested tumors from WT mice showed an increased percentage of CD11bhigh neutrophils in the B16 tumors when the tumor-bearing WT mice were treated with G-CSF. This percentage was similar to that seen in LLC tumors from untreated mice (n = 5–6). (C) Western blot showed increased H3Cit in 17-d tumor lysate of B16 tumors from WT mice treated with G-CSF than from untreated mice (left) whereas this was not observed in PAD4−/− mice (right). (D) Confocal microscopy confirmed the presence of higher amounts of H3Cit and NETs in the B16 tumors from WT mice treated with G-CSF that was absent in B16 tumors from PAD4−/− mice similarly treated.

Reprints and Corporate Permissions

Please note: Selecting permissions does not provide access to the full text of the article, please see our help page How do I view content?

To request a reprint or corporate permissions for this article, please click on the relevant link below:

Academic Permissions

Please note: Selecting permissions does not provide access to the full text of the article, please see our help page How do I view content?

Obtain permissions instantly via Rightslink by clicking on the button below:

If you are unable to obtain permissions via Rightslink, please complete and submit this Permissions form. For more information, please visit our Permissions help page.