Figures & data
Figure 1. NKp30 isoform Δ ratios predict overall survival in metastatic GIST patients. (A) The NKp30 ΔAB (left panel), ΔAC (middle panel) and ΔBC ratios (right panel) of healthy volunteers (HV, n = 106) and of metastatic GIST patients (n = 126) are shown, non-parametric Mann–Whitney test. (B)–(D). Overall survival from initial imatinib mesylate (IM) treatment of GIST patients according to the median value of ΔAB (left), ΔAC (middle) and ΔBC ratios (right), were assessed by univariate analysis using the Kaplan–Meier method in a test cohort (n = 71, B), validation cohort (n = 55, C) and pooled cohort (n = 126, D). (E) Kaplan–Meier curves of GIST patient overall survival based on the combination of NKp30 Δ ratios and the KIT11 mutational status are shown for the pooled cohort (n = 126), Log-rank (Mantel–cox). *p < 0.05, **p < 0.01, ***p < 0.001. ns = not significant.
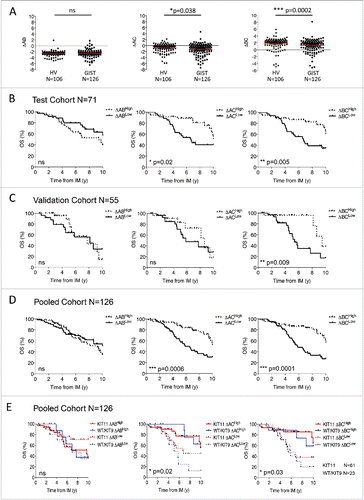
Figure 2. The pro-inflammatory milieu, but not Th1 cytokines are associated with ΔBCLow GIST patients. (A) Cytokine secretion (TNF-α, IFN-γ, IL-12p40) was assessed from frozen tumor samples obtained from ΔBCHigh (n = 5) and ΔBCLow (n = 5) GIST patients, compared using unpaired t-test. (B) Chemokine (CCL2/MCP-1 and CCL5) and cytokine (IL-1β, IL-8 and IL-10 (shown in A)) concentrations were measured from tumor samples fluids of ΔBCHigh (n = 11) and ΔBCLow (n = 7) GIST patients, normalized per mg of total protein/mL (as detailed in M&M) and compared using unpaired t-test. (C)–(D) Cytokine and chemokine secretion, namely IFN-γ, IL-17, GM-CSF, and IL-12p40 (C) as well as SCF, SDF-1α and TNF-β (D), were assessed from micro-dissected stromal and intra-tumoral frozen GIST samples. GIST patients were stratified according to their clinical status, NED—non-evolutive disease (n = 10) and AWD—alive with disease (n = 4), at a median time of 1.2 y post-surgery, Mann–Whitney test. *p < 0.05, **p < 0.01.
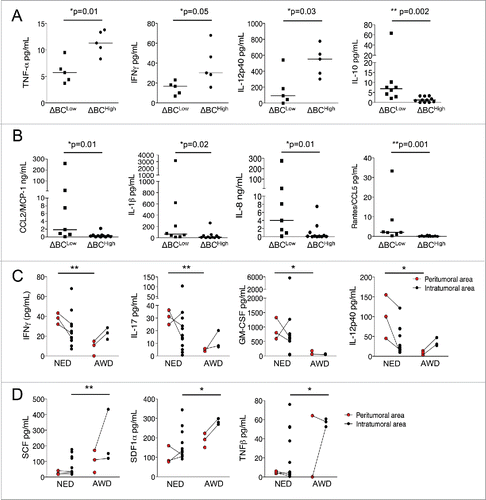
Figure 3. Relative expression levels of NKp30 isoforms predict EFS and OS in metastatic GIST patients. Event-free survival (A & C) and overall survival (B & D) of metastatic GIST patients according to the median relative expression of NKp30A (left), NKp30B (middle) and NKp30C (right) isoforms, was assessed at the start of imatinib mesylate (IM) therapy at diagnosis (A–B, n = 67) and at the time of sampling (C–D, n = 126) by univariate analysis using the Kaplan–Meier method. (E) Kaplan–Meier curves of overall survival based on combination of the relative expression of NKp30 isoforms with the KIT11 mutation status are shown for the pooled cohort (n = 126). *p < 0.05, **p < 0.01, ***p < 0.001 by Log-rank (Mantel–cox) test.
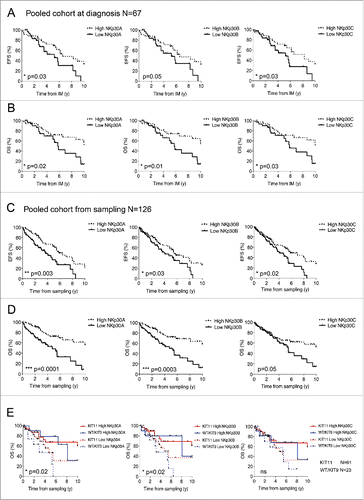
Figure 4. NKp30 ΔBC ratio combined with NKp30A isoform relative expression highlight a subgroup of metastatic GIST patients with poor prognosis. Kaplan–Meier curves of event free survival (upper panels) and overall survival (lower panels) obtained by stratifying the pooled metastatic GIST cohort (n = 126) from the beginning of imatinib mesylate (IM) treatment (A) or at the time of sampling (B), into four groups according to the median value of NKp30 ΔBC ratio with the median relative expression of NKp30A isoform. Of note, Fig. S6 shows segregation based on the median value of NKp30 ΔBC ratio with the median relative expression of NKp30B and C isoforms. **p < 0.01, ***p < 0.001 by Log-rank (Mantel–cox) test.
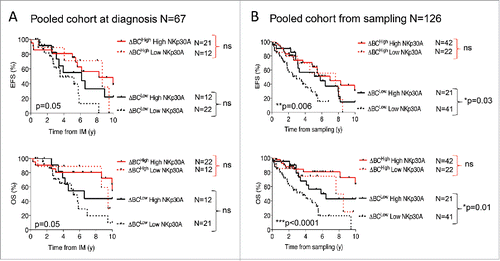
Table 1. Multivariate analysis of prognosis factors for survival of metastatic GIST patients from the date of sampling (Cox model).
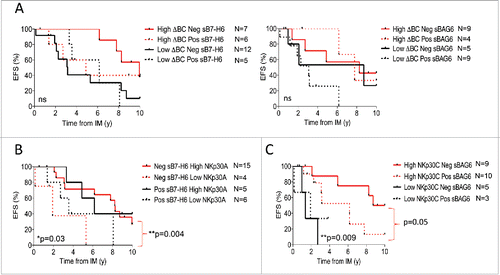
Figure 5. Soluble NKp30 ligands, B7-H6 and BAG6, are biomarkers in metastatic GIST patients. (A)–(C) Levels of sB7-H6 (left panel) and sBAG6 (right panel) measured in metastatic GIST patient serum as related to tumor resection (A), to IM therapy (B) or to the ΔBC ratio (C). (D) Event-free survival of metastatic GIST patients from the time of IM according to the median value of sB7-H6 (n = 50, left panel) and from the time of sampling in the course of IM therapy according to the median value of sBAG6 (n = 67, right panel) was assessed using the Kaplan–Meier method. (E) Representative frequency of metastatic GIST patient presenting no, either one, or both soluble NKp30L at diagnosis, prior to IM therapy (n = 29, left panel). Kaplan–Meier curves of event free survival of 29 metastatic GIST patients from the time of IM according to serum levels of both NKp30 ligands *p < 0.05, **p < 0.01, ***p < 0.001, ns—not significant by non-parametric Mann–Whitney test in (A)–(C); *p < 0.05, **p < 0.01 using the Kaplan–Meier method in (D)–(E).
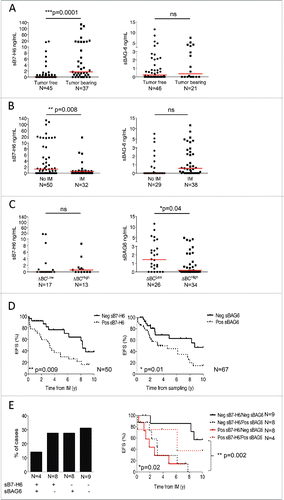
Figure 6. Event-free survival in metastatic GIST can be best predicted by the coordinated analysis of several NKp30-related parameters. (A) Event-free survival of metastatic GIST patients from the time of IM according to the ΔBClow phenotype and the median values of sB7-H6 (n = 30, left panel) or sBAG6 (n = 27, right panel) was assessed using the Kaplan–Meier method. (B)–(C) Analysis of predictive interactions between the relative expression levels of NKp30 isoforms and serum levels of NKp30 ligands. Event-free survival of metastatic GIST patients from the time of IM according to the sB7-H6 levels and NKp30A relative expression (B) and the median value of the levels of NKp30 isoforms C and sBAG6 levels (C), using the Kaplan–Meier method. Of note, Fig. S10 shows EFS of NKp30L levels with the additional NKp30 isoforms. *p < 0.05, **p < 0.01, ns: not significant by Log-rank (Mantel–Cox) test.