1,298
Views
18
CrossRef citations to date
0
Altmetric
Original Research

Rituximab-based treatments followed by adoptive cellular immunotherapy for biopsy-proven EBV-associated post-transplant lymphoproliferative disease in recipients of allogeneic hematopoietic stem cell transplantation

, , , , , , , , , , , , , , , , & show all
Article: e1139274 | Received 19 Oct 2015, Accepted 03 Jan 2016, Published online: 10 Mar 2016

Figures & data

Table 1. Characteristics of patients receiving rituximab-monotherapy or rituximab+chemotherapy

Table 2. Characteristics of patients receiving DLI or EBV-CTL for inducing CR

Figure 1. Study profile. DLI, Granulocyte colony-stimulating factor-mobilized donor lymphocyte infusion; EBV-CTL, Epstein-Barr virus-specific cytotoxic T lymphocytes; PD, progression of disease; CR, complete remission; MODS, multiple-organ disfunction syndrome; PFS, progression-free survival; OS, overall survival. *: included two CR patients not receiving DLI or EBV-CTL.
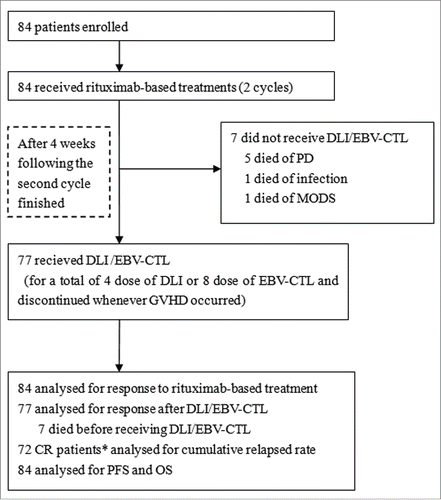
Figure 1. Study profile. DLI, Granulocyte colony-stimulating factor-mobilized donor lymphocyte infusion; EBV-CTL, Epstein-Barr virus-specific cytotoxic T lymphocytes; PD, progression of disease; CR, complete remission; MODS, multiple-organ disfunction syndrome; PFS, progression-free survival; OS, overall survival. *: included two CR patients not receiving DLI or EBV-CTL.

Figure 2. Lymphocyte percentages in circulation and EBV-specific cytotoxic lymphocyte activity of patients who received DLI and EBV-CTL infusion. No significant difference was observed between patients received DLI and EBV-CTL in lymphocytes (CD3+ T cells, p = 0.552; CD16+CD56+ NK cells, p = 0.549; CD19+ B cells, p = 0.704). (A), (B) and (C): The percentages of CD3+ T cells, and CD16+CD56+ NK cells before cellular immunotherapies were not different from those before rituximab-based treatment (p = 0.471 and p = 0.603, respectively), while the CD19+ B cells before the cell infusions were less than those before the rituximab-based treatments (p < 0 .001). The percentages of CD3+ T cells, CD16+CD56+ NK cells, CD19+ B cells were increased in the 1st month after cellular immunotherapies than those before cell infusions (p = 0.001, p = 0.01, p < 0 .001, respectively), higher in the 3rd month than those in the 1st month after DLI or EBV-CTL (p < 0 .001, p = 0.009, p < 0 .001, respectively), and reached their maximal in the 3rd, 6th, 6th month, respectively. The CD4+ T cell to CD8+ T cell ratio increased since the 3rd month (p < 0.001), no differences among the 6th, 9th and 12th month. (D) In the spot assay, the IFNγ spot numbers before the cell infusion were not different from those before rituximab-based treatments (p = 0.296), while more in the 1st month than those before cell infusion (p < 0 .001), more in the 3rd month than those in the 1st month after cellular immunotherapies (p < 0 .001) and more in the 6th month than those in the 3rd month (p < 0 .001), no differences among the 6th, 9th and 12th month after cellular immunotherapies. The EBV-CTL activity in EBV-CTL treatment group was higher than that in the DLI group (p = 0.001). Notes: Arrows denote the time of rituximab-based treatments.
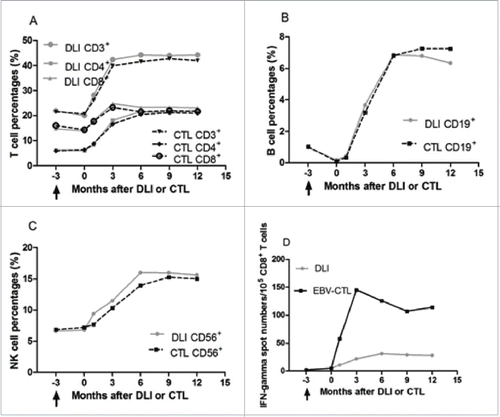
Figure 2. Lymphocyte percentages in circulation and EBV-specific cytotoxic lymphocyte activity of patients who received DLI and EBV-CTL infusion. No significant difference was observed between patients received DLI and EBV-CTL in lymphocytes (CD3+ T cells, p = 0.552; CD16+CD56+ NK cells, p = 0.549; CD19+ B cells, p = 0.704). (A), (B) and (C): The percentages of CD3+ T cells, and CD16+CD56+ NK cells before cellular immunotherapies were not different from those before rituximab-based treatment (p = 0.471 and p = 0.603, respectively), while the CD19+ B cells before the cell infusions were less than those before the rituximab-based treatments (p < 0 .001). The percentages of CD3+ T cells, CD16+CD56+ NK cells, CD19+ B cells were increased in the 1st month after cellular immunotherapies than those before cell infusions (p = 0.001, p = 0.01, p < 0 .001, respectively), higher in the 3rd month than those in the 1st month after DLI or EBV-CTL (p < 0 .001, p = 0.009, p < 0 .001, respectively), and reached their maximal in the 3rd, 6th, 6th month, respectively. The CD4+ T cell to CD8+ T cell ratio increased since the 3rd month (p < 0.001), no differences among the 6th, 9th and 12th month. (D) In the spot assay, the IFNγ spot numbers before the cell infusion were not different from those before rituximab-based treatments (p = 0.296), while more in the 1st month than those before cell infusion (p < 0 .001), more in the 3rd month than those in the 1st month after cellular immunotherapies (p < 0 .001) and more in the 6th month than those in the 3rd month (p < 0 .001), no differences among the 6th, 9th and 12th month after cellular immunotherapies. The EBV-CTL activity in EBV-CTL treatment group was higher than that in the DLI group (p = 0.001). Notes: Arrows denote the time of rituximab-based treatments.

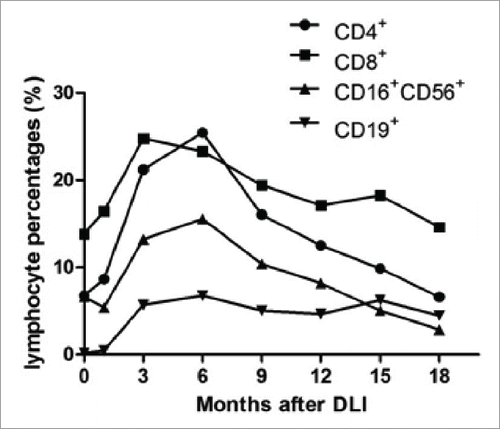
Figure 3. Lymphocyte subsets in a relapsed PTLD patient.

Figure 3. Lymphocyte subsets in a relapsed PTLD patient.

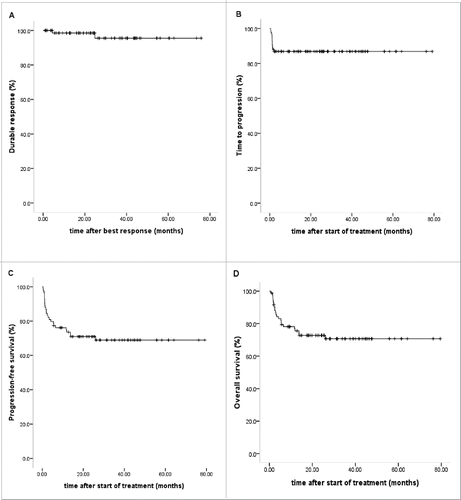
Figure 4. Response duration, time to progression, progression-free survival and overall survival.

Figure 4. Response duration, time to progression, progression-free survival and overall survival.

Reprints and Corporate Permissions

Please note: Selecting permissions does not provide access to the full text of the article, please see our help page How do I view content?

To request a reprint or corporate permissions for this article, please click on the relevant link below:

Academic Permissions

Please note: Selecting permissions does not provide access to the full text of the article, please see our help page How do I view content?

Obtain permissions instantly via Rightslink by clicking on the button below:

If you are unable to obtain permissions via Rightslink, please complete and submit this Permissions form. For more information, please visit our Permissions help page.