Figures & data
Figure 1. Lysosome-mediated cell death induced by type II CD20 mAbs can overcome rituximab resistance. (A) Evaluation of cell death induced by CD20 mAbs with or without cross-linker on Raji, Raji-R, Daudi and Daudi-R cells. Columns represent mean cell death (Annexin V- and PI-positive cells) (n = 3); bars represent SD. *p < 0.05.(B) Effect of Caspase Inhibitor VI on the cell death induced in 16 h by inhibitor alone, 10 μg/mL rituximab, and 11B8 in the presence or absence of cross-linker (goat anti-human F(ab′)2 fragment, 20 μg/mL) in Raji cells. Inhibitors were added over a range of different concentrations for 2 h before the addition of mAbs. Data are mean ± SD of at least three experiments. (C) Raji cells were incubated with CD20 mAbs as described previously (10 μg/mL). After that, cells were labeled with Lyso-Tracker green and the volume of the lysosomal compartment measured by confocal microscopy after 4 h. (D) Fluorescence microscopy of the lysosomal protease cathepsin B staining (red) of Raji cells 4 h after treatment with mAbs. DNA was counterstained with DAPI (blue; scale bar, 10 μm). (E) The inhibition of CD20 mAb-induced cell death by cathepsin inhibitor III in Raji cells as measured by FCM. Mean ± SD (n = 3). *p < 0.05. (F) Confocal microscopy of cathepsin B staining (red) 4 h after treatment with CD20 mAbs. DNA was counterstained with DAPI (blue). Scale bars: 10 μm. The survival of tumor-bearing SCID mice SCID/Raji (G) and SCID/Raji-R (H) treated with anti-CD20 mAbs. Groups of 10 SCID mice were injected intravenously with 3.5 × 10⁶ Raji or Raji-R cells. Five days after tumor cell inoculation, the mice were treated with rituximab and 11B8 (400 μg/dose). The SCID/Raji and SCID/Raji-R mice were treated with cathepsin inhibitor (E-64d) at a dose of 1 mg/100 g of body weight/day intraperitoneally 3 d a week for 3 weeks.
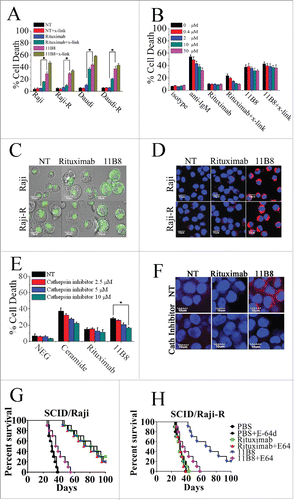
Figure 2. De novo ceramide synthesis involved in LMP-mediated cell death initiated by type II CD20 mAb. (A) The inhibition of cell death in Ramos cells by A-SMase, N-SMase and ceramide synthase inhibitors (Imip, 3-OMe-SM and FB1, respectively) was assessed by FCM. Error bars indicate SD (n = 3). *p < 0.05. (B) The exogenous ceramide (C2-Ceramide) induced cell death in both Raji and Ramos cells in a dose-dependent manner. *p < 0.05. (C) Time course study of ceramide generation in B cells induced by CD20 mAbs. The ceramide levels were quantitated as described in “Supplemental Experimental Procedures.” Results are representative of three independent experiments. (D) The generation of ceramide stimulated by 11B8 was inhibited by FB1. Raji cells were treated with FB1 prior to the addition of CD20 mAbs. *p < 0.05. Detection of total lysosomal volume in cells treated with mAbs and FB1. Cells were incubated with CD20 mAbs (10 μg/mL) and FB1 (25 μM). After that, cells were labeled with LysoTracker green and the volume of the lysosomal compartment measured by confocal microscopy (E) and FCM (F) after 4 h. (G and H) The assessment of LMP by evaluating the release of cathepsin B (red) into cytoplasm. Scale bars: 10 μm.
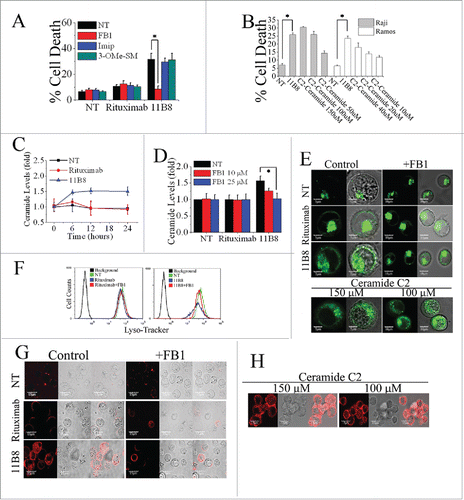
Figure 3. The important role of DEGS1 in the initiation of LMP-mediated cell death. (A and B) After downregulation of DEGS1 in Raji (Raji/DEGS1-) and Ramos (Ramos/DEGS1-) cells, the induction of cell death by CD20 mAbs was evaluated by FCM. Data represent means with SD (n = 3). *p < 0.05. (C) Confocal microscopy of intracellular cathepsin B (red) in Raji and Raji/DEGS1- cells to assess the extent of LMP induced by CD20 mAbs. Raji cells transfected with the control vectors were used as the control. DNA was counterstained with DAPI (blue). Scale bars: 10 μm. (D) The intracellular ceramide level was determined after treatment with CD20 mAbs for 16 h. Columns, mean (n = 3); bars, SD. *p < 0.05. (E) The dihydroceramide-induced death in CD20 mAb-treated cells was determined by staining of SYTOX Red on FCM. Bars represent the mean cell death + SD from three independent experiments. *p < 0.05. (F) Confocal analysis of cathepsin B release after dihydroceramide and CD20 mAbs treatment.
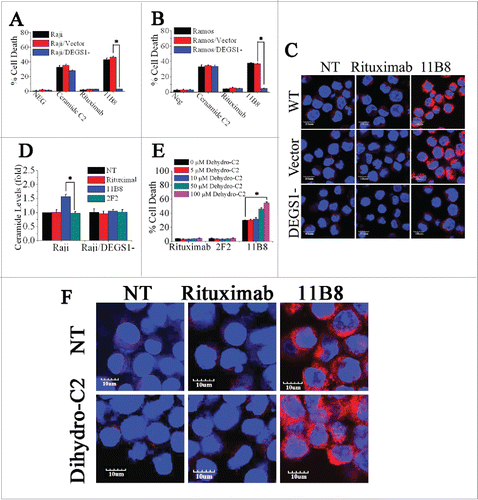
Figure 4. Induction of LMP is directly mediated by sphingosine. (A) A time-course analysis of intracellular sphingosine level after treatment with CD20 mAbs. Points represent mean (n = 3); bars represent SD. (B) The inhibition of sphingosine generation by D-MAPP was evaluated. Data are mean ± SD (n = 3). *p < 0.05. (C) The cell death induced by CD20 mAbs was inhibited by D-MAPP. Cell death was determined by staining of SYTOX Red on FCM. Bars represent the mean cell death + SD from three independent experiments. *p < 0.05. (D) Evaluation of D-MAPP on the release of cathepsin B. Cathepsin B was immunostained (red) and nuclear DNA was stained with DAPI (blue). Scale bars, 10 μm. (F) Dose-dependent induction of cell death by exogenous sphingosine. Cells were stained with SYTOX Red and detected on FCM Data are mean ± SD (n = 3). *p < 0.05. (E) Dose-dependent cathepsin B release determined by confocal analysis. Cathepsin B, red; DAPI, blue. Scale bars, 10 μm. (G) Lysosomal fraction in buffered 300 mM sucrose was exposed for 30 min at 37°C to sphingosine at the concentrations indicated. After centrifugation, supernatant activity was expressed as a percentage of total activity (following treatment with 0.1 M Triton X-100).
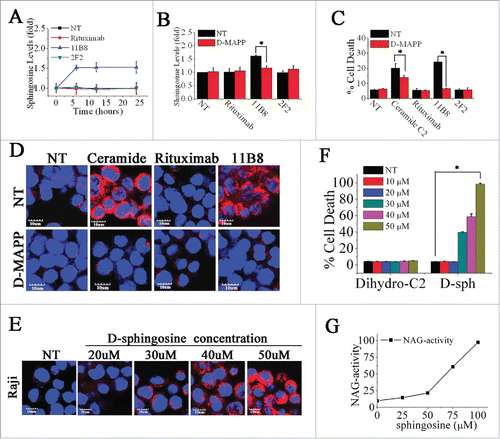
Figure 5. Rituximab variant H102YK exhibiting marked therapeutic efficacy against RR lymphoma. (A) Effect of cathepsin inhibitor on the cell death induced in 48 h by inhibitor alone, 10 μg/mL rituximab, and rituximab variant in Raji cells. Cathepsin inhibitor III was added over a range of different concentrations for 2 h before the addition of mAbs. Data are mean ± SD (n = 3). *p < 0.05. The release of cathepsin B (B) and the intracellular ceramide generation (C) in Raji cells were examined by confocal analysis. Cathepsin B and ceramide were immunostained (red) and nuclear DNA was stained with DAPI (blue). Scale bars, 10 μm. (D) The induction of cell death by CD20 mAbs in Raji and Raji/DEGS1- was evaluated. Data represent means with SD (n = 3). *p < 0.05. (E) Evaluation of cell death induced by CD20 mAbs with or without cross-linker on Raji, rituximab-resistant Raji (Raji-R) and 11B8-resistant Raji (Raji-B) cells. Columns represent mean (n = 3); bars represent SD. *p < 0.05. (F) Induction of cell death on normal peripheral blood (PB) B cells, DLBCL (N = 19), rituximab-refractory DLBCL (n = 17), B-CLL (n = 15), rituximab-refractory B-CLL (n = 14) was evaluated by XTT assay. The absorbance values indicate the cell viability in the experiment conditions. *p < 0.05. Raji and resistant Raji cells were exposed to CD20 mAbs (10 μg/each or 20 μg/each), followed by the addition of NHS (G) or PBMCs (H), respectively. *p < 0.05. The survival of tumor-bearing SCID mice treated with anti-CD20 mAbs . Groups of 10 SCID mice were injected intravenously with 3.5 × 10⁶ Raji (I) or Raji-R cells (J). Five days after tumor cell inoculation, the mice were treated with rituximab, rituximab variant H102YK or simultaneous treatment with rituximab and 11B8 (100 μg/each mice in SCID/Raji).
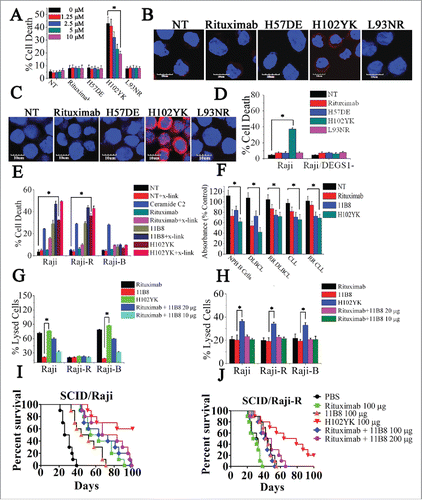
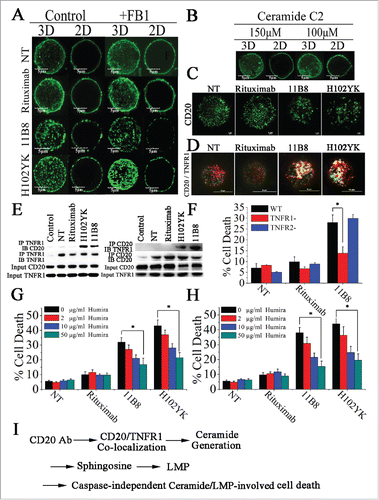
Figure 6. Colocalization of CD20 and TNFR1 initiated by CD20 mAbs is critical for initiation of lysosome-mediated cell death by CD20 mAbs. (A) Confocal images of the distribution of CD20 molecule after treatment with CD20 mAbs for 30 min. 3D reconstruction based on a confocal z-stack. (B) The impact of exogenous C2-ceramide on the spatial arrangement of CD20. Scale bars: 5 μm. (C) TIRF-SIM images of the distribution of CD20 in the bilayer before and after treatment with CD20 mAbs. Scale bars: 1 μm. (D) 3D-SIM images of the colocalization of CD20 (green fluorescence) and TNFR1 (red fluorescence) proteins before and after treatment with CD20 mAbs. The images were acquired by a structured illumination microscopy N-SIM (Nikon). Scale bars: 1 μm. (E) CD20 is recruited to the TNFR-1 signaling complex after treatment with type II CD20 mAbs and H102YK. The recruitment of CD20 protein was determined by western blot. Control: NT group used isotype antibody for IP, CD20 or TNFR1 antibody for IB. (F) The essential role of TNFR1 in induction of cell death triggered by type II CD20 mAbs. *p < 0.05. The inhibition of cell death by Humira after 48 h by Humira alone, 10 μg/mL rituximab, and rituximab variant in Raji (G) and Ramos (H) cells. Humira was added over a range of different concentrations for 2 h before the addition of mAbs. Data are mean ± SD (n = 3). *p < 0.05. (I) A proposed model role for initiation of lysosome-mediated cell death induced by CD20 antibodies.