Figures & data
Table 1. Demographic and clinical characteristics of patients and controls
Table 2. TTR and OS of HCC patients according to clinical characteristics, NK-cell frequency and phenotype cluster.
Figure 1. Phenotype and function of NK-cells in patients and controls. (A) Dot plots showing gating strategy and phenotype for CD3ζ, perforin and NKG2A in a representative healthy subject, a patient with HCV-related liver cirrhosis and a patient with HCC (left to right). (B) Differential distribution of NK-cell phenotypes and functional parameters in HCC patients and controls. CD107a expression was evaluated on unstimulated NK-cells. Significance levels are shown on top of each panel.
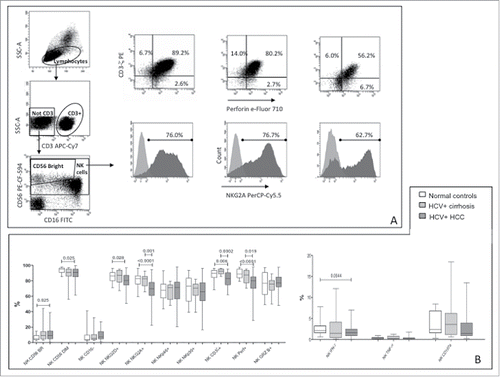
Figure 2. Hierarchical clustering analysis of 24 NK-cell phenotypic markers in patients with HCV-linked HCC. The heat map represents the frequency of each phenotype (higher expression in red and lower expression in green). Clustering analysis was done after median centering on both the tested markers and patients using Ward's linkage and Euclidean distance.
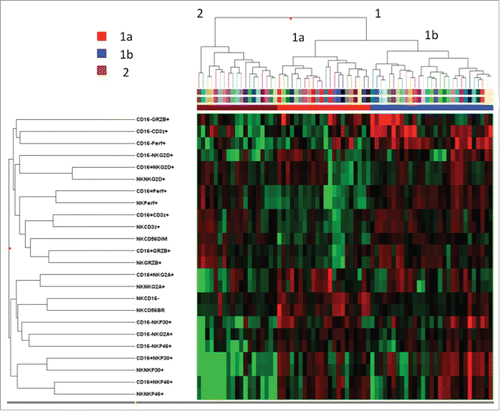
Figure 3. Kaplan–Meier curves of overall survival (OS) and time to recurrence (TTR) of HCC patients according to NK-cell phenotypic clustering. Left panels: comparison of patient clusters 1a, 1b and 2 (); right panels: comparison between patient cluster 1a and clusters 1b+2. Significance values (log-rank test) are shown on top of each panel.
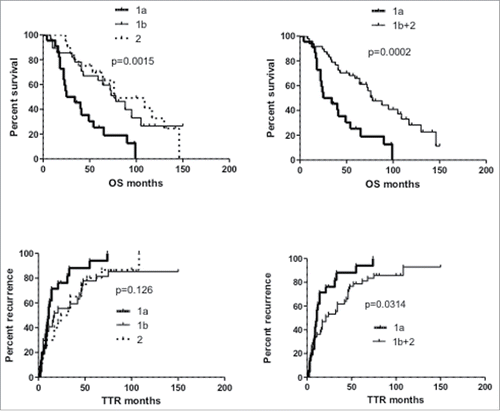
Table 3. Comparison of NK-cell phenotypic subsets according to hierarchical clustering of HCC patients. Mann–Whitney test. SD: standard deviation; TL: total lymphocytes; BR: bright; NS: not significant
Figure 4. Co-expression of NKG2A, NKp30 and NKp46 in NK-cells from HCC patients and controls. (A) Strategy for the flow cytometric analysis of receptor co-expression in NK-cells; (B) Frequency of NK-cells co-expressing NKG2A, NKp30 and NKp46 in HCC patients' clusters and in controls. Significance levels are reported.
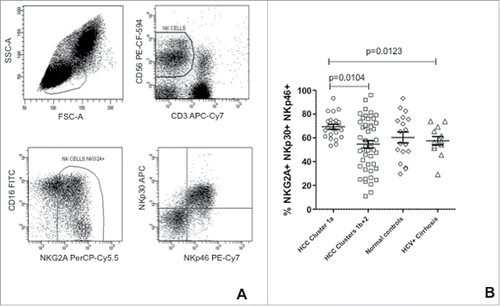
Figure 5. Cytotoxic function of NK-cells from HCC patients and controls. (A) Dot plots show upregulation of CD107a in NK-cells after incubation with K562 target cells with and without IL-15 activation in representative patients and controls. Top to bottom: HCC cluster 1a, HCC cluster 1b+2, healthy control, HCV-related cirrhosis. (B) Results are shown with or without overnight activation with IL-15. Percent cytotoxicity was normalized to the frequency of circulating CD3−CD56+ cells. Significance levels are reported.
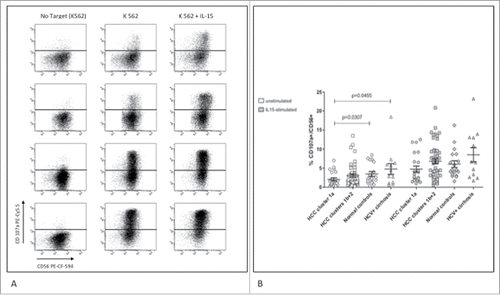
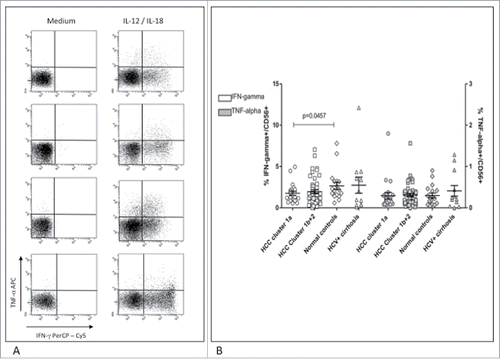
Figure 6. Cytokine production in NK-cells from patients and controls. (A) Dot plots show staining of NK-cells for IFNγ and TNF-α upon IL-12/IL-18 stimulation in representative patients and controls. Top to bottom: HCC cluster 1a, HCC cluster 1b+2, healthy control, HCV-related cirrhosis. (B) Frequency of NK-cells producing IFNγ (left axis, white symbols) and TNF-α (right axis, gray symbols) was normalized to the frequency of circulating CD3−CD56+ cells. Significance levels are reported.