9,258
Views
200
CrossRef citations to date
0
Altmetric
Original Research

Targeting CD73 in the tumor microenvironment with MEDI9447

, , , , , , , , , , , , , , , , & show all
Article: e1208875 | Received 12 Apr 2016, Accepted 28 Jun 2016, Published online: 11 Jul 2016

Figures & data

Figure 1. CD73-expressing human NCI-H322 (Panel A) or mouse 4T1 (Panel B) cells were incubated with AMP and MEDI9447 or an isotype control antibody at the indicated concentrations. Following incubation, ATP and CellTiter-Glo® were added and light emission inhibition was measured by luminometer. The mean signal of duplicate samples is plotted with error bars representing the standard deviation of the mean. Data are representative of five independent experiments.

Figure 1. CD73-expressing human NCI-H322 (Panel A) or mouse 4T1 (Panel B) cells were incubated with AMP and MEDI9447 or an isotype control antibody at the indicated concentrations. Following incubation, ATP and CellTiter-Glo® were added and light emission inhibition was measured by luminometer. The mean signal of duplicate samples is plotted with error bars representing the standard deviation of the mean. Data are representative of five independent experiments.

Figure 2. Internalization of CD73 upon binding by MEDI9447 was demonstrated. MDA-MB-231 human breast carcinoma cells were incubated with MEDI9447 and a fluorescently labeled anti-human IgG secondary antibody. Localization of CD73 was imaged after 2 h at 4°C (Panel A) or 37°C and again after 4 (Panel C) and 20 (Panel D) h at 37°C. Internalization of CD73 upon MEDI9447 binding was also demonstrated by measuring MDA-MB-231 (Panel E) and mouse 4T1 (Panel F) breast cancer cell viability following MEDI9447 binding in the presence of a toxin-conjugated secondary antibody. The indicated concentrations of MEDI9447 were incubated with a saporin-conjugated anti-human IgG antibody for 3 d and viability was estimated by measuring ATP levels using the Cell Titer-Glo assay kit. Data are representative of five independent experiments.
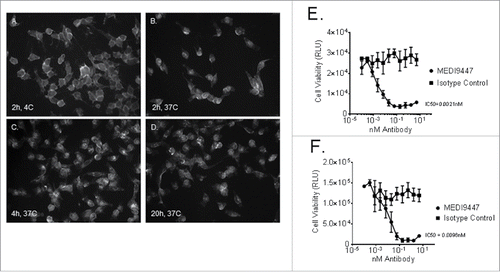
Figure 2. Internalization of CD73 upon binding by MEDI9447 was demonstrated. MDA-MB-231 human breast carcinoma cells were incubated with MEDI9447 and a fluorescently labeled anti-human IgG secondary antibody. Localization of CD73 was imaged after 2 h at 4°C (Panel A) or 37°C and again after 4 (Panel C) and 20 (Panel D) h at 37°C. Internalization of CD73 upon MEDI9447 binding was also demonstrated by measuring MDA-MB-231 (Panel E) and mouse 4T1 (Panel F) breast cancer cell viability following MEDI9447 binding in the presence of a toxin-conjugated secondary antibody. The indicated concentrations of MEDI9447 were incubated with a saporin-conjugated anti-human IgG antibody for 3 d and viability was estimated by measuring ATP levels using the Cell Titer-Glo assay kit. Data are representative of five independent experiments.

Figure 3. CFSE-labeled CD4+ T cells were pre-activated with anti-CD3 and anti-CD28 antibody-coated microbeads and recombinant human IL-2 and then transferred into sterile round-bottomed tissue culture 96 well plates at approximately 50,000 cells per well. T cell proliferation and division was suppressed by the addition of 100-µM AMP. Addition of MEDI9447 and Phen0203 human IgG1 overcame the inhibitory effect of AMP in a concentration-dependent manner. Isotype control antibody R3-47 had no effect. The average of triplicate samples is plotted and error bars represent the standard deviation. Data are representative of three independent experiment.
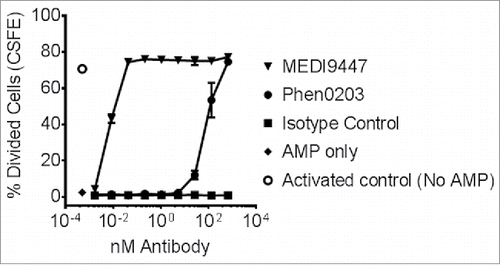
Figure 3. CFSE-labeled CD4+ T cells were pre-activated with anti-CD3 and anti-CD28 antibody-coated microbeads and recombinant human IL-2 and then transferred into sterile round-bottomed tissue culture 96 well plates at approximately 50,000 cells per well. T cell proliferation and division was suppressed by the addition of 100-µM AMP. Addition of MEDI9447 and Phen0203 human IgG1 overcame the inhibitory effect of AMP in a concentration-dependent manner. Isotype control antibody R3-47 had no effect. The average of triplicate samples is plotted and error bars represent the standard deviation. Data are representative of three independent experiment.

Figure 4. Equal proportions of peripheral blood mononuclear cells from two healthy donors were mixed and incubated in wells of a 96 well plate for 96 h. Panel (A) shows brightfield images were taken at 24 h intervals using a 2.5× objective. Cells were treated with 150 µg/mL of either MEDI9447 (top panel) or and isotype control antibody (bottom panel). Panels (B–D). Equal proportions of peripheral blood mononuclear cells from two healthy donors were mixed incubated in wells of a 96 well plate for 72 h. Cells were treated with the indicated concentrations of either MEDI9447 (circles) or an isotype control antibody (squares). The plate was centrifuged to pellet cells and interferon-γ (Panel B), interleukin-1 β (Panel C), and tumor necrosis factor-α (Panel D) levels in the supernatants were measured by ELISA. Data are representative of experiments involving over 50 different donor-pair combinations.
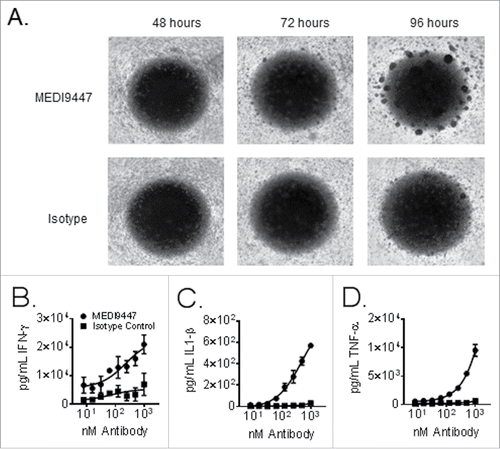
Figure 4. Equal proportions of peripheral blood mononuclear cells from two healthy donors were mixed and incubated in wells of a 96 well plate for 96 h. Panel (A) shows brightfield images were taken at 24 h intervals using a 2.5× objective. Cells were treated with 150 µg/mL of either MEDI9447 (top panel) or and isotype control antibody (bottom panel). Panels (B–D). Equal proportions of peripheral blood mononuclear cells from two healthy donors were mixed incubated in wells of a 96 well plate for 72 h. Cells were treated with the indicated concentrations of either MEDI9447 (circles) or an isotype control antibody (squares). The plate was centrifuged to pellet cells and interferon-γ (Panel B), interleukin-1 β (Panel C), and tumor necrosis factor-α (Panel D) levels in the supernatants were measured by ELISA. Data are representative of experiments involving over 50 different donor-pair combinations.

Figure 5. (A). Murine CT26 colon carcinoma tumor cells were implanted subcutaneously then treated at 10 mg/kg with MEDI9447, or an isotype control (or untreated), by intraperitoneal injection on days 3, 6, 10, and 13 post-tumor implantation. An untreated control group was also included. The mean tumor volumes of each 10 animal group are plotted with error bars representing the standard error of the mean. Asterisks indicate a statistically significant (*p < 0.05) reduction in tumor volume. (B). Tumor-infiltrating leukocytes were isolated at study day 16 and analyzed by flow cytometry. CD8+ T effector cells were significantly increased in the tumor following treatment with MEDI9447. Data are representative of three independent experiments.
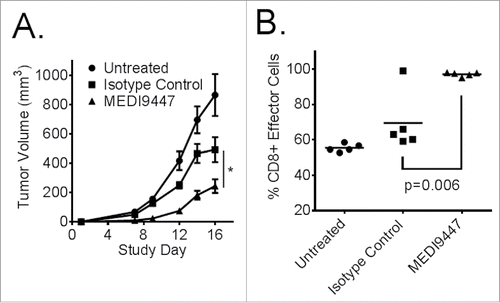
Figure 5. (A). Murine CT26 colon carcinoma tumor cells were implanted subcutaneously then treated at 10 mg/kg with MEDI9447, or an isotype control (or untreated), by intraperitoneal injection on days 3, 6, 10, and 13 post-tumor implantation. An untreated control group was also included. The mean tumor volumes of each 10 animal group are plotted with error bars representing the standard error of the mean. Asterisks indicate a statistically significant (*p < 0.05) reduction in tumor volume. (B). Tumor-infiltrating leukocytes were isolated at study day 16 and analyzed by flow cytometry. CD8+ T effector cells were significantly increased in the tumor following treatment with MEDI9447. Data are representative of three independent experiments.

Figure 6. CT26 tumor-infiltrating leukocyte analysis from individual responder (R) and non-responder (NR) mice following MEDI9447 treatment. Murine CT26 colon carcinoma tumors cells were implanted subcutaneously then treated at 10 mg/kg with MEDI9447 by intraperitoneal injection on days 3, 6, 10, and 13 post-tumor implantation. Panel (A). Tumor volumes for individual mice treated with MEDI9447. Whole tumors were removed, dissociated into single cell suspensions, and analyzed by flow cytometry. The fraction of the following subpopulations were determined: total leukocytes (CD45+, Panel B), CD4+ lymphocytes (Panel C), monocyte-derived suppressor cells (Panel D), major histocompatibility (MHCII, Panel E ) expressed on F480+ macrophages as well as the mean fluorescent intensity of MHC2 (Panel F). Each symbol represents the phenotype indicated in the y axis for individual mice. Asterisks indicate significant (p < 0.05) differences between treatment arms. Data are representative of two independent experiments.
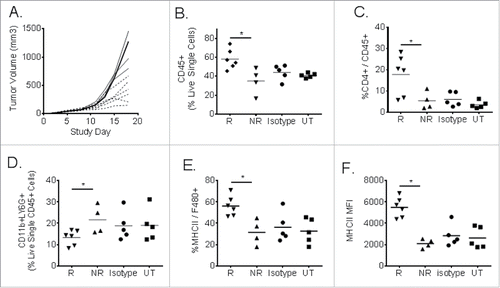
Figure 6. CT26 tumor-infiltrating leukocyte analysis from individual responder (R) and non-responder (NR) mice following MEDI9447 treatment. Murine CT26 colon carcinoma tumors cells were implanted subcutaneously then treated at 10 mg/kg with MEDI9447 by intraperitoneal injection on days 3, 6, 10, and 13 post-tumor implantation. Panel (A). Tumor volumes for individual mice treated with MEDI9447. Whole tumors were removed, dissociated into single cell suspensions, and analyzed by flow cytometry. The fraction of the following subpopulations were determined: total leukocytes (CD45+, Panel B), CD4+ lymphocytes (Panel C), monocyte-derived suppressor cells (Panel D), major histocompatibility (MHCII, Panel E ) expressed on F480+ macrophages as well as the mean fluorescent intensity of MHC2 (Panel F). Each symbol represents the phenotype indicated in the y axis for individual mice. Asterisks indicate significant (p < 0.05) differences between treatment arms. Data are representative of two independent experiments.

Figure 7. Murine CT26 colon carcinoma tumor cells were implanted subcutaneously and then treated at 10 mg/kg, by intraperitoneal injection on days 3, 7, 10, and 14 post-tumor implantation, with isotype control antibody (Panel A, open circles), MEDI9447 (Panel A, closed circles), anti-PD-1 (Panel B, squares) antibodies or a combination of MEDI9447 and anti-PD-1 (Panel C, diamonds) antibodies. Tumor volumes for individual animals are plotted until study day 29. The proportion of surviving mice after 40 d (Panel E) and the number of tumor-free mice in each treatment arm are shown. A 72-h mixed leukocyte reaction was performed using human peripheral blood mononuclear cells in the presence of anti-PD-1, MEDI944 or a combination of each antibody. The mean levels of secreted IFNγ and TNFα from duplicate samples are plotted (Panel F). The asterisk indicates a significant (p < 0.05) increase in survival. Data are representative of four independent experiments.
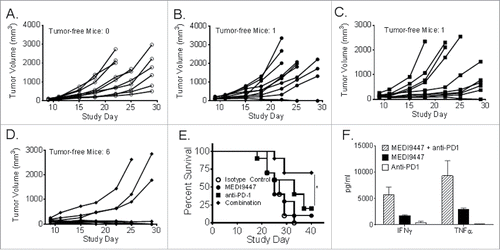
Figure 7. Murine CT26 colon carcinoma tumor cells were implanted subcutaneously and then treated at 10 mg/kg, by intraperitoneal injection on days 3, 7, 10, and 14 post-tumor implantation, with isotype control antibody (Panel A, open circles), MEDI9447 (Panel A, closed circles), anti-PD-1 (Panel B, squares) antibodies or a combination of MEDI9447 and anti-PD-1 (Panel C, diamonds) antibodies. Tumor volumes for individual animals are plotted until study day 29. The proportion of surviving mice after 40 d (Panel E) and the number of tumor-free mice in each treatment arm are shown. A 72-h mixed leukocyte reaction was performed using human peripheral blood mononuclear cells in the presence of anti-PD-1, MEDI944 or a combination of each antibody. The mean levels of secreted IFNγ and TNFα from duplicate samples are plotted (Panel F). The asterisk indicates a significant (p < 0.05) increase in survival. Data are representative of four independent experiments.
Supplemental material

KONI_A_1208875_supplementary_data.zip

Download Zip (230.9 KB)