2,111
Views
23
CrossRef citations to date
0
Altmetric
Original Research

HLA class I-restricted MYD88 L265P-derived peptides as specific targets for lymphoma immunotherapy

, , , , , , , , , , , , , , , & show all
Article: e1219825 | Received 01 Apr 2016, Accepted 28 Jul 2016, Published online: 03 Mar 2017

Figures & data

Figure 1. Prediction of MYD88L265P-derived HLA class I ligands. 50 MYD88L265P-derived 8- to 12-mer peptides were scored by the online prediction tools SYFPEITHI and NetMHC 3.4, as well as an extended in-house database. Peptides with NetMHC 3.4 IC50≤ 500 nM were defined as binders (region left of the dotted line). SYFPEITHI scores are displayed as percent of the maximum score for the respective HLA allotype. The threshold for binders is defined as ≥ 50% of the maximum score (above the dotted line). For some HLA:peptide combinations scoring was possible with only one of the prediction tools due to limited availability of predictors. The figure illustrates the predicted ligands for HLA-A and -B allotypes. Fold-change ratios in binding scores of mutated peptides compared with the corresponding WT peptides are indicated by the size of the respective dot: large dots indicate an at least 2-fold better score, mutated ligands illustrated by small dots exhibit no increased binding score in comparison to their corresponding WT ligand. Out of 50 unique peptide sequences, 23 were scored as potential HLA class I ligands. Four ligands were concordantly designated as ligands of the same HLA allotype by both algorithms with three of them having an at least 2-fold higher score as their corresponding WT peptide. The black dots indicate the peptides which were tested in aAPC-based in vitro primings in HBDs or CLL patients. Abbreviations: max., maximal.
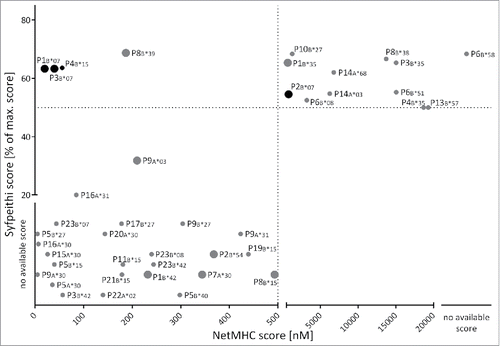
Figure 1. Prediction of MYD88L265P-derived HLA class I ligands. 50 MYD88L265P-derived 8- to 12-mer peptides were scored by the online prediction tools SYFPEITHI and NetMHC 3.4, as well as an extended in-house database. Peptides with NetMHC 3.4 IC50≤ 500 nM were defined as binders (region left of the dotted line). SYFPEITHI scores are displayed as percent of the maximum score for the respective HLA allotype. The threshold for binders is defined as ≥ 50% of the maximum score (above the dotted line). For some HLA:peptide combinations scoring was possible with only one of the prediction tools due to limited availability of predictors. The figure illustrates the predicted ligands for HLA-A and -B allotypes. Fold-change ratios in binding scores of mutated peptides compared with the corresponding WT peptides are indicated by the size of the respective dot: large dots indicate an at least 2-fold better score, mutated ligands illustrated by small dots exhibit no increased binding score in comparison to their corresponding WT ligand. Out of 50 unique peptide sequences, 23 were scored as potential HLA class I ligands. Four ligands were concordantly designated as ligands of the same HLA allotype by both algorithms with three of them having an at least 2-fold higher score as their corresponding WT peptide. The black dots indicate the peptides which were tested in aAPC-based in vitro primings in HBDs or CLL patients. Abbreviations: max., maximal.

Figure 2. Spontaneous memory T cell responses are detectable in a leukemia patient. The presence of memory T cell responses in leukemia and lymphoma patients was analyzed using 12-d recall IFNγ ELISPOT assays. (A) In a single (out of 22 tested) MYD88L265P+ NHL patients (CLL-05-R) IFNγ secretion was observed after stimulation with the MYD88L265P-derived peptides P5B*15/B*40 (HQKRPIPI) and P1C*03 (RPIPIKYKAM). (B) Representative example of a MYD88L265P+ patient (CLL-03-R) where no IFNγ secretion was observed after stimulation with the MYD88L265P-derived peptides P5B*15 (HQKRPIPI) and P1C*03 (RPIPIKYKAM). An EBV epitope mix containing the frequently recognized peptides BRLF1 109–117 YVLDHLIVV (HLA-A*02) and EBNA3 247–255 RPPIFIRRL (HLA-B*07) served as positive control. Benign-tissue derived peptide DDX5 YLLPAIVHI (HLA-A*02) served as negative control. The dotted line indicates the 3-fold number of spot forming unit of the negative control. Error bars indicate ± SEM of two independent replicates. Abbreviations: SFU, spot forming unit; neg., negative; pos., positive; SEM, standard error of the mean.
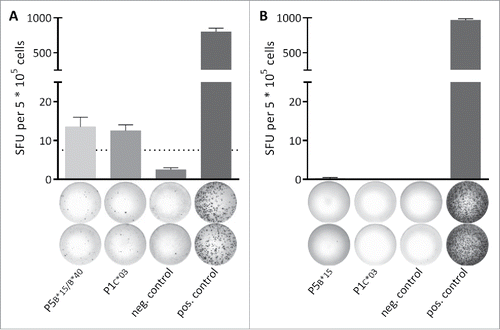
Figure 2. Spontaneous memory T cell responses are detectable in a leukemia patient. The presence of memory T cell responses in leukemia and lymphoma patients was analyzed using 12-d recall IFNγ ELISPOT assays. (A) In a single (out of 22 tested) MYD88L265P+ NHL patients (CLL-05-R) IFNγ secretion was observed after stimulation with the MYD88L265P-derived peptides P5B*15/B*40 (HQKRPIPI) and P1C*03 (RPIPIKYKAM). (B) Representative example of a MYD88L265P+ patient (CLL-03-R) where no IFNγ secretion was observed after stimulation with the MYD88L265P-derived peptides P5B*15 (HQKRPIPI) and P1C*03 (RPIPIKYKAM). An EBV epitope mix containing the frequently recognized peptides BRLF1 109–117 YVLDHLIVV (HLA-A*02) and EBNA3 247–255 RPPIFIRRL (HLA-B*07) served as positive control. Benign-tissue derived peptide DDX5 YLLPAIVHI (HLA-A*02) served as negative control. The dotted line indicates the 3-fold number of spot forming unit of the negative control. Error bars indicate ± SEM of two independent replicates. Abbreviations: SFU, spot forming unit; neg., negative; pos., positive; SEM, standard error of the mean.

Figure 3. Efficient in vitro generation of P4B*15- and P1B*07-specific CD8+ T cells from naive T cells of CLL patients and HBDs. Representative tetramer stainings of CD8+ T cells after three cycles of aAPC-based in vitro priming using CD8+ T cells derived from HLA-matched HBDs primed with (A) the HLA-B*15-restricted peptide HQKRPIPIKY (P4B*15) and (B) the HLA-B*07-restricted peptide RPIPIKYKAM (P1B*07) as well as from HLA-matched MYD88WT CLL patient (CLL-05) primed with (C) the HLA-B*07-restricted peptide RPIPIKYKAM (P1B*07): 1st column: tetramer staining of CD8+ T cells primed with the MYD88L265P-derived peptide; 2nd column: control staining with HLA-matched tetramer containing a non-relevant control peptide on CD8+ T cells derived from the same population as T cells depicted in the 1st column; 3rd column: ex vivo tetramer staining of CD8+ T cells. In vitro primings with HBD-derived PBMCs were performed in six (P1B*07) and three (P4B*15) independent replicates, respectively. For the in vitro priming with PBMCs of CLL patients two independent replicates were conducted. Abbreviations: neg., negative.
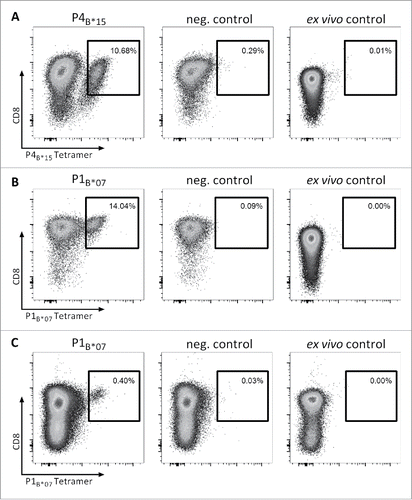
Figure 3. Efficient in vitro generation of P4B*15- and P1B*07-specific CD8+ T cells from naive T cells of CLL patients and HBDs. Representative tetramer stainings of CD8+ T cells after three cycles of aAPC-based in vitro priming using CD8+ T cells derived from HLA-matched HBDs primed with (A) the HLA-B*15-restricted peptide HQKRPIPIKY (P4B*15) and (B) the HLA-B*07-restricted peptide RPIPIKYKAM (P1B*07) as well as from HLA-matched MYD88WT CLL patient (CLL-05) primed with (C) the HLA-B*07-restricted peptide RPIPIKYKAM (P1B*07): 1st column: tetramer staining of CD8+ T cells primed with the MYD88L265P-derived peptide; 2nd column: control staining with HLA-matched tetramer containing a non-relevant control peptide on CD8+ T cells derived from the same population as T cells depicted in the 1st column; 3rd column: ex vivo tetramer staining of CD8+ T cells. In vitro primings with HBD-derived PBMCs were performed in six (P1B*07) and three (P4B*15) independent replicates, respectively. For the in vitro priming with PBMCs of CLL patients two independent replicates were conducted. Abbreviations: neg., negative.

Figure 4. Functionality and specificity of MYD88L265P-specific T cells. Functionality and specificity of MYD88L265P-specific CD8+ T cells were analyzed by (A) IFNγ ELISPOT assay or (B, C) intracellular cytokine staining. Both assays showed increased production of IFNγ or TNFα after stimulation with the mutation-derived peptide (P1B*07) in comparison with the corresponding WT peptide (P1WT). Representative examples of two different donors are shown. The frequency of P1B*07-specific CD8+ T cell populations was 2.69% (A) and 0.40% (B and C), respectively, as detected by tetramer staining (not shown). Error bars indicate ± SEM of two independent replicates. Abbreviations: SFU, spot forming unit; neg., negative; pos., positive; SEM, standard error of the mean.
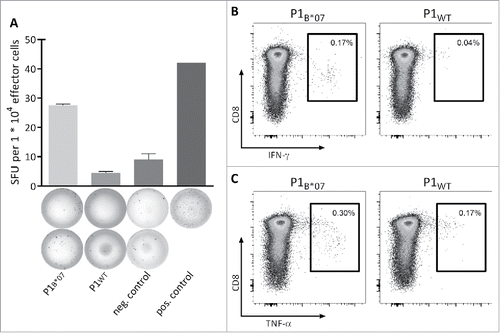
Figure 4. Functionality and specificity of MYD88L265P-specific T cells. Functionality and specificity of MYD88L265P-specific CD8+ T cells were analyzed by (A) IFNγ ELISPOT assay or (B, C) intracellular cytokine staining. Both assays showed increased production of IFNγ or TNFα after stimulation with the mutation-derived peptide (P1B*07) in comparison with the corresponding WT peptide (P1WT). Representative examples of two different donors are shown. The frequency of P1B*07-specific CD8+ T cell populations was 2.69% (A) and 0.40% (B and C), respectively, as detected by tetramer staining (not shown). Error bars indicate ± SEM of two independent replicates. Abbreviations: SFU, spot forming unit; neg., negative; pos., positive; SEM, standard error of the mean.

Figure 5. MYD88L265P-selective cytotoxicity of P4B*15-specific effector cells. The MYD88L265P-specific cytotoxicity was analyzed in a VITAL cytotoxicity assay with CD8+ effector cells of in vitro primed cells of HBDs. (A, B) Tetramer staining of polyclonal effector cells one day before the VITAL assay determined the number of P4B*15-specific effector cells in the (A) population of successfully P4B*15-primed CD8+ T cells and in the (B) population of control cells primed with a HLA-matched non-relevant peptide. These control cells were used as unspecific effectors for the determination of the unspecific lysis of target cells. (C) At an effector to target ratio of 1:1 P4B*15-specific effectors (▴) exerted 17.9% (±1.2%) MYD88L265P-specific and significant higher lysis of P4B*15-loaded autologous target cells in comparison to P4WT-loaded cells. P4B*15-unspecific effectors (×) only caused 2.6% (±1.2%) unspecific lysis of the same targets. Results are shown for three independent replicates. Error bars indicate ± SEM. Abbreviations: SEM, standard error of the mean; n.s., not significant; * p > 0.05; ** p > 0.01; *** p > 0.001.
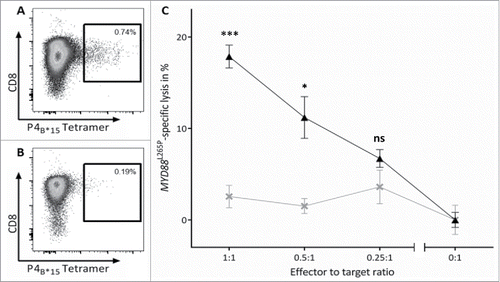
Figure 5. MYD88L265P-selective cytotoxicity of P4B*15-specific effector cells. The MYD88L265P-specific cytotoxicity was analyzed in a VITAL cytotoxicity assay with CD8+ effector cells of in vitro primed cells of HBDs. (A, B) Tetramer staining of polyclonal effector cells one day before the VITAL assay determined the number of P4B*15-specific effector cells in the (A) population of successfully P4B*15-primed CD8+ T cells and in the (B) population of control cells primed with a HLA-matched non-relevant peptide. These control cells were used as unspecific effectors for the determination of the unspecific lysis of target cells. (C) At an effector to target ratio of 1:1 P4B*15-specific effectors (▴) exerted 17.9% (±1.2%) MYD88L265P-specific and significant higher lysis of P4B*15-loaded autologous target cells in comparison to P4WT-loaded cells. P4B*15-unspecific effectors (×) only caused 2.6% (±1.2%) unspecific lysis of the same targets. Results are shown for three independent replicates. Error bars indicate ± SEM. Abbreviations: SEM, standard error of the mean; n.s., not significant; * p > 0.05; ** p > 0.01; *** p > 0.001.
Supplemental material

KONI_A_1219825_s02.pdf

Download PDF (695.8 KB)