Figures & data
Figure 1. BMP4 promotes tumor growth and metastasis via an immunosuppressive microenvironment. (A) 1 × 10⁶ 393P_vector and 393P_BMP4 tumor cells were subcutaneously injected into 129/Sv mice. Mice were sacrificed, and tumor weight and lung metastatic nodules were measured 6 weeks post-cell injection. The summary of tumor mass and lung metastatic nodules is shown in the left panel (n = 5 animals/group). The tumor photos are shown on the right top. H- and E-stained lung tissue is shown in the right bottom, indicating the metastatic lesions. Scale bar, 2 mm. (B) 1 × 10⁶ 344SQ-scr and 344SQ-shBMP4 tumor cells were subcutaneously injected into 129/Sv mice (n = 10/group). Mice were sacrificed, and tumor weight and lung metastatic nodules were measured 6 weeks post-cell injection. The summary of tumor mass and lung metastatic nodules is shown in the panel. (C) Intratumoral Ki67+CD8+ T cells in 344SQ-scr or 344SQ-shBMP4 primary tumors 2 weeks post-subcutaneous injection of cancer cells into 129/Sv mice. Representative histograms are shown on the left, and mean Ki67+ populations of gated CD8+ T cells in total T cells are shown on the right (n = 5). (D) Fluorescence-activated cell sorting analysis of CD4+TIL and CD8+TIL frequency from 393P_vector, 393P_BMP4, 344SQ-scr, or 344SQ-shBMP4 (n = 5) primary tumors. Analysis was done 2 weeks post-cancer cell injection. The representative plots are shown on the left, and the aggregate data is shown on the right. (E) 2 × 10⁶ indicated cells were subcutaneously injected into 129/Sv mice (four mice each group). Tumors were harvested and tumor lysates prepared 2 weeks post-cancer cell injection. ELISA assays were conducted twice and the data were pooled. *p < 0.05, **p < 0.01, ***p < 0.001, ****p < 0.0001. (F and G) Fluorescence-activated cell sorting analysis of (F) T cell dysfunction markers PD1 and TIM3 expression on CD8+ T cells, and (G) Foxp3+ regulatory T cells from 393P_vector, 393P_BMP4, 344SQ-scr, or 344SQ-shBMP4 (n = 5) primary tumors. Analysis was done 2 weeks post-cancer cell injection. The representative plots are shown on the left, and the statistical summary is shown on the right. (H) The CD8+/Treg ratio was calculated by dividing the total number of CD8+ TILs infiltrating the tumor by the total number of CD4+Foxp3+ T-cell infiltrate. Percent of CD8+ T-cell infiltrate was calculated as a percent of total CD3+ T-cell infiltrate. The percent of Treg infiltrate was calculated as a percent of total CD4+ T cells in the tumor fraction. (I) CD8+ T cell numbers were measured in splenocytes cultured with or without cancer cells for 5 d in the presence of anti-CD3 stimulation (5 μg/mL) and Interleukin 2 (1 μg/mL). Results are means with standard deviations for triplicate samples.
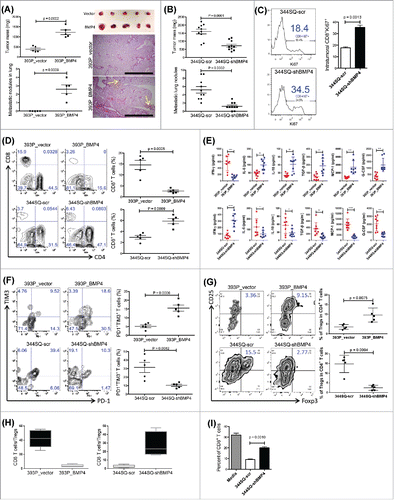
Figure 2. CD8+ T cell response plays a dominant role in BMP4-mediated tumor growth and metastasis. (A) Mice were pretreated with anti-CD8+ antibody (2.43; BioXCell; 400 μg, intraperitoneally) one week before tumor cell injection. 200 μg of anti-CD8+ antibody per mouse was injected into the mice once weekly for 5 weeks beginning on day 1 after a subcutaneous cancer cell injection (2 × 10⁶ indicated cells per mouse; n = 5–6 mice/group). The tumor growth was measured once a week for 6 weeks. To test the CD8+ T cell depletion efficiency, spleen cells were stained with anti-CD4+ and anti-CD8+ antibodies. The tumor growth curve is shown on the top, and CD8+ T cell depletion efficiency is shown in the bottom; (B) at the endpoint, mice were necropsied to harvest primary tumors and lungs, which were weighed, and to quantify distant metastases. (C) To prepare CD8+ T cells, 129/Sv mice were challenged with 2 × 10⁶ 393P_BMP4 for 2 weeks (subcutaneously injected). CD8+ T cells were isolated from these tumors, blood, and spleens. To conduct the treatment experiment, 1 × 10⁶ tumor cells were subcutaneously inoculated into mice 1 week before T cell transfer, then mice received cyclophosphamide at 100 mg/kg intravenously 6 h before CD8+ T cell transfer (5 × 10⁶ per mouse, intravenously), following IL-2 (20,000 units, intraperitoneally) at 8 h after T cell transfer then every 12 h for 3 d. The tumor growth was measured once a week for 6 weeks. The tumor growth curves are shown on the right top (n = 5–6 mice/group). **p < 0.01; (D) at the endpoint, mice were necropsied to harvest primary tumors and lungs, which were weighed, and to quantify distant metastases.
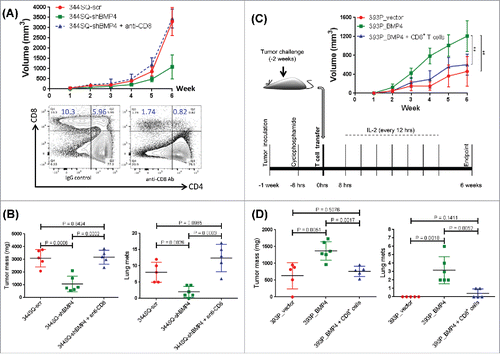
Figure 3. BMP4 regulates PD-L1 expression on tumor cells and thereby causes T cell dysfunction. (A) The effect of BMP4 siRNA on PD-L1 expression in murine KP lung cancer cells. Cells were transfected with 40 nM siRNA or the control for 3 d before FACS analysis. PD-L1 expression levels were calculated by the ratio of anti-PD-L1 stained MFI/isotype stained MFI (MFI, mean fluorescence intensity). (B) The representative FACS histogram of PD-L1 (MFI, mean fluorescence intensity) expression in primary subcutaneous tumors grown in syngeneic 129/Sv mice (n = 3) injected with the indicated cell lines is shown in the upper panel. The representative PD-L1 immunohistochemical staining of each tumor type is shown in the lower panel. Samples were obtained 2 weeks post-cell injection. Scale bar, 100 μm. (C) Cell surface expression of PD-L1 analyzed by FACS 5 d post-treatment with rBMP4 at the indicated concentrations. PD-L1 expression levels were calculated by the ratio of anti-PD-L1 stained MFI/isotype stained MFI. Data are represented as mean ± SD. (D) Cells were incubated with BMP4 inhibitor LDN193189 at different concentrations (25 nM and 50 nM) for 5 d and stained with anti-PD-L1 antibody. PD-L1 expression levels were calculated by the ratio of anti-PD-L1 stained MFI/isotype stained MFI. The experiments were repeated three times. (E) Representative FACS histogram of cell surface expression of PD-L1 on different mouse lung cancer cell lines with or without IFNγ stimulation (48 h stimulation). Red line, isotype control staining; blue line, anti-PD-L1 staining. (F) FACS analysis of surface expression of PD-L1 on different cancer cells co-cultured with 129/Sv spleen cells for 2 d. Representative FACS histograms are shown. Red, control isotype antibody staining; light blue, anti-mouse PD-L1 antibody staining for cancer cells cultured without spleen cells; and pink, anti-mouse PD-L1 antibody staining for cancer cells cultured with spleen cells. (G) FACS analysis of markers of T cell dysfunction. 129/Sv spleen cells were cultured for 4 d with various cancer cells in the presence of anti-CD3 stimulation (5 μg/mL) and Interleukin 2 (1 μg/mL). 344SQ-shBMP4 cells were transfected with PD-L1 (indicated in red). The data shown in left panel (means with standard deviations) are percentages of gated CD8+ T cells that were PD1+TIM3+ and are representative of at least three independent experiments. *p < 0.05. PD-L1 transfection efficiency was measured by FACS and the representative histograms are shown in right panel.
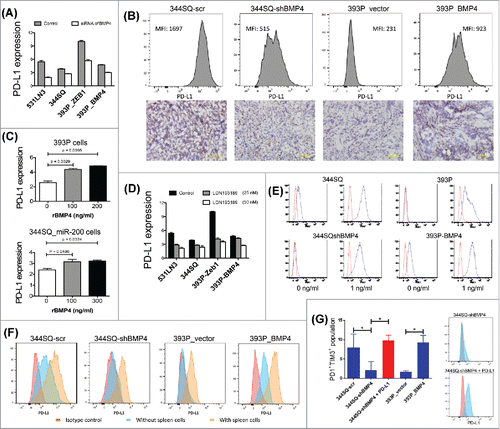
Figure 4. BMP4high metastatic cells have high levels of activated STAT3 & STAT3 directly regulates PD-L1. (A) A panel of KP cell lines was grown in vitro under full serum (10%) conditions or washed and grown in the absence of serum for 24 h prior to harvest of protein lysates, which were then analyzed by RPPA. The samples were dichotomized into epithelial or mesenchymal groups based upon miR-200/ZEB1 expression and dot plots show the activated pY705-STAT3 levels for each group and growth condition. (B) The same panel of cell lines was used for Western blot of the indicated EMT markers, total STAT3, and activated STAT3, versus β-actin as a loading control. (C) An isogenic EMT panel of cell lines constructed from the 393P parental line was used for Western blotting of the total and activated STAT3 levels. (D) STAT3 activates PD-L1 in mouse lung cancer cells. The effects were assessed by relative luciferase activity. PD-L1 (CD274) promoters (PMT-1: −1,187 ∼ +801 bp, PMT-2: −1,701 ∼ +216 bp from the transcription start site) were isolated from a mouse BAC clone (RPCI-23 434F3, BACPAC Resources Center at the Children's Hospital Oakland Research Institute) by PCR and ligated into the pGL3-basic vector (Promega). 344SQ cells were seeded on 24-well plates (1 × 10⁵ cells per well) one day before transfection. Cells were co-transfected with 500 ng pGL3-basic or PD-L1 promoters and 250 ng STAT3 expression vector (pIREShyg3/STAT3). The vector expression efficiency of STAT3 shown in left was measured by Western blotting. pRL-TK (50 ng, Promega) was co-transfected as an internal control. After 48 h of transfection, luciferase activity was measured with Dual-Luciferase Reporter Assay System (Promega) according to the manufacturer's protocol. Values are normalized to those of pGL3-basic vector (mean ± SD, n = 3). p-values are indicated (two-tailed Student's t-test). (E) Cells seeded in six-well plate were transfected with siRNA against STAT3 (50 nM) as well as their scrambled controls, respectively. The cells were harvested 3 d after transfection to examine PD-L1 expression. MFI of PD-L1 expression was calculated with FlowJo software. PD-L1 expression levels were calculated by the ratio of anti-PD-L1 stained MFI/isotype stained MFI. The knockdown efficiency of siRNA of STAT3 was measured by qPCR. The experiments were repeated three times. (F) Cells seeded in six-well plate were treated with STAT3 inhibitor VIII at the indicated concentrations for 3 d. PD-L1 expression was analyzed by flow cytometry. PD-L1 expression levels were calculated by the ratio of anti-PD-L1 stained MFI/isotype stained MFI.
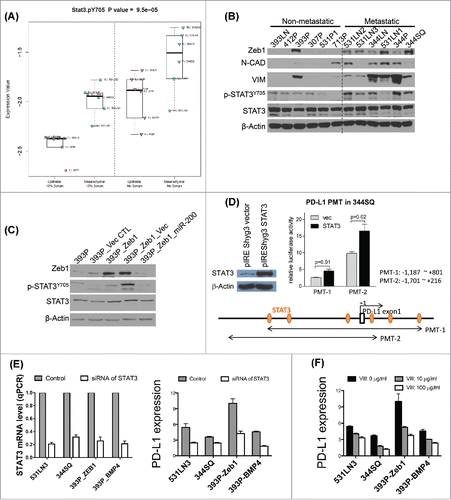
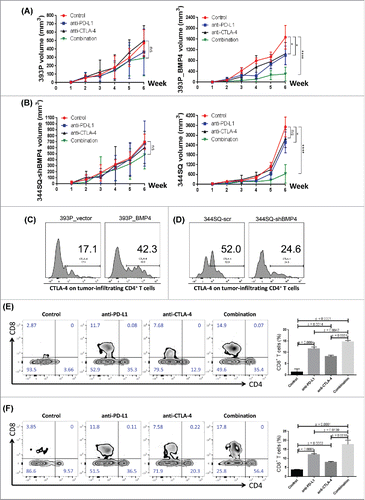
Figure 5. BMP4-mediated tumor progression is targetable by anti-PD-L1 alone or in combination with anti-CTLA-4. (A, B) The indicated antibody or an isotype-matched IgG control was injected into 129/Sv mice (intraperitoneally) once a week for 5 weeks beginning on day 1 after the subcutaneous indicated tumor cell injection (2 × 10⁶ cells per mouse). Dosing per injection was 200 μg of anti-PD-L1, 150 μg of anti-CTLA-4. Tumors were measured once a week for 6 weeks. The tumor growth curves are shown. ns, no significant difference, *p < 0.05, ****p < 0.0001. (C, D) 2 × 10⁶ indicated cells were subcutaneously injected into 129/Sv mice (four mice each group). Tumors were harvested and CTLA-4 expression on tumor-infiltrating CD4+ T cells was analyzed by FACS 2 weeks post-cancer cell injection. (E, F) Fluorescence-activated cell sorting analysis of CD4+TIL and CD8+TIL frequency from the endpoint primary tumors. The representative plots are shown on the left, and the statistical summary is shown on the right. The data from 344SQ tumors are shown in (E); the data from 393P_BMP4 tumors are shown in (F).