
Figures & data
Figure 1. Schematic representation of hu14.18-IL2 immunocytokines. (A) Parental immunocytokine (ICp) with original intact huIL2 bound to the H-chains of the hu14.18 mAb. (B) IC35, with huIL2 bound to the L-chains of the ch14.18 mAb. (C) IC45, with a huIL2 variant missing 5 a.a. bound to the L-chains of the ch14.18 mAb. (D) ICSK, with the IL2 superkine mutein exhibiting enhanced binding to IL2Rβ bound to the L-chains of the ch14.18 mAb. Dark gray portion represents the 98% human portion of the hu14.18 mAb that recognizes GD2. Light gray portion represents the mouse framework in the chimeric mAb. Red portion represents the 2% mouse protein remaining in the antigen-binding region.
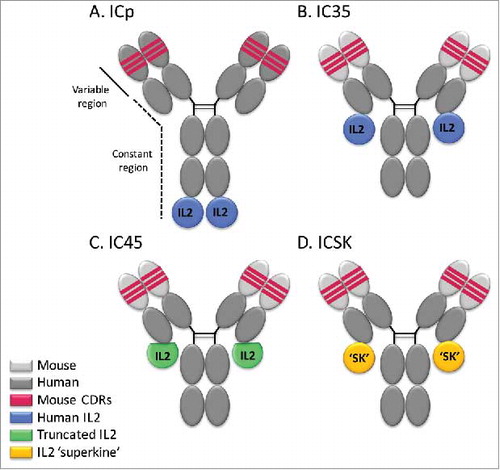
Table 1. IL2 bioactivity in the presence of anti-IL2Rα and/or anti-IL2Rβ inhibitory mAbs.
Figure 2. Effect of anti-IL2Rα and anti-IL2Rβ inhibitory mAbs on IL2 induced proliferation. (A) Tf-1β, (B) Kit225, (C) SCID splenocytes, or (D) CTLL 2 cells were incubated with inhibitory mAbs. MAbs used in (A) and (B) GL439 (anti-huIL2Rα), MikB1 (anti-huIL2Rβ) and in (C) and (D) PC61 (anti-muIL2Rα) and TM-β1 (anti-muIL2Rβ), each at 10 µg/mL for 30–60 min at 4C prior to addition of IL2. In (B) and (D), a combination of species-appropriate anti-IL2Rα and anti-IL2Rβ mAbs were also tested. Cells were cultured for 72 h at 37°C and were pulse labeled with 1 µCi of 3H thymidine for 6 h. Error bars indicate SD of triplicate samples. Data are representative of 2–10 separate experiments. Statistical differences of biological significance are represented with an asterisk *p-value = <0.001.
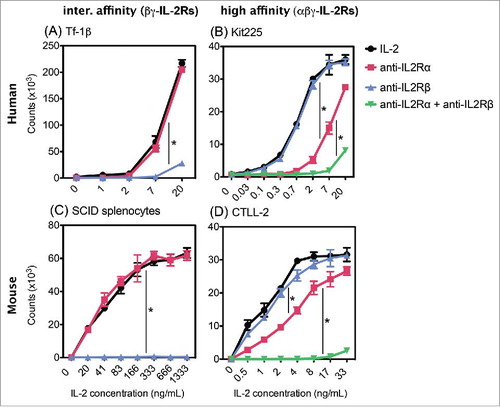
Figure 3. Novel ICs exhibit reduced ability to induce proliferation of cells expressing βγ-IL2Rs. Comparison of IC35 and IC45 induced proliferation on: (A) Tf-1β, (B) Kit225, (C) CTLL-2, and (D) SCID splenocytes. Cells were stimulated with increasing concentrations of IL2, ICp, IC35, or IC45 and cultured for 72 h at 37°C. The counts were determined by [3H]TdR incorporation by proliferating cells. Error bars indicate SD of triplicate samples. Data are representative of two–six separate experiments. Statistical differences of biological significance are represented with an asterisk *p-value = <0.001.
![Figure 3. Novel ICs exhibit reduced ability to induce proliferation of cells expressing βγ-IL2Rs. Comparison of IC35 and IC45 induced proliferation on: (A) Tf-1β, (B) Kit225, (C) CTLL-2, and (D) SCID splenocytes. Cells were stimulated with increasing concentrations of IL2, ICp, IC35, or IC45 and cultured for 72 h at 37°C. The counts were determined by [3H]TdR incorporation by proliferating cells. Error bars indicate SD of triplicate samples. Data are representative of two–six separate experiments. Statistical differences of biological significance are represented with an asterisk *p-value = <0.001.](/cms/asset/fd81b6bc-dfed-4e15-a244-536f41591bde/koni_a_1238538_f0003_oc.jpg)
Table 2. IL2 bioactivity of IL2, ICp, IC35 and IC45.
Figure 4. Blocking IL2Rα allows Kit225 and CTLL-2 to respond through βγ-IL2Rs. Inhibitory antibody against the α-chain of the IL2R effects proliferation of cells expressing high affinity IL2Rs (B) and (D) but not cells expressing intermediate affinity IL2Rs (A) and (C). (A) Tf-1β, (B) Kit225, (C) CTLL-2, and (D) SCID splenocytes were incubated with inhibitory mAbs at 10 µg/mL for 30–60 min at 4C prior to addition of IL2. Cells were cultured for 72 h at 37°C and were pulse labeled with 1 µCi of 3H thymidine for 6 h. Error bars indicate SD of triplicate samples. Data are representative of 2–10 separate experiments. Statistical differences of biological significance are represented with an asterisk *p-value = <0.001.
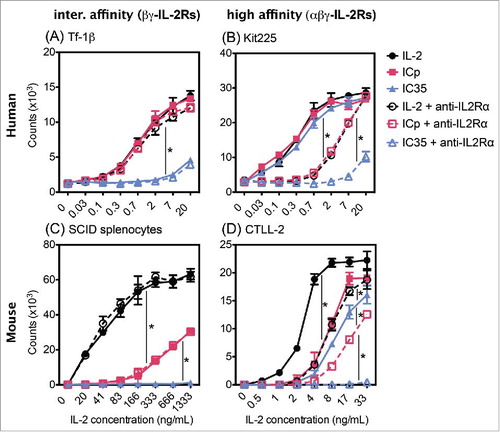
Table 3. IC bioactivity in the presence of anti-IL2Rα.
Figure 5. The “superkine” molecules within ICSK rescue the ability to elicit proliferation through βγ-IL2Rs. Comparison of IC35 and ICSK induced proliferation on: (A) Tf-1β, (B) Kit225, (C) SCID splenocytes, and (D) CTLL-2. Cells were stimulated with increasing concentrations of IL2, ICp, ICSK, or IC35 and cultured for 72 h at 37°C. The counts were determined by [3H]TdR incorporation by proliferating cells. Error bars indicate the SD of triplicate samples. Data are representative of six–eight separate experiments. Statistical differences of biological significance are represented with an asterisk *p-value = <0.001. Bold font: These values are similar when compared to one another.
![Figure 5. The “superkine” molecules within ICSK rescue the ability to elicit proliferation through βγ-IL2Rs. Comparison of IC35 and ICSK induced proliferation on: (A) Tf-1β, (B) Kit225, (C) SCID splenocytes, and (D) CTLL-2. Cells were stimulated with increasing concentrations of IL2, ICp, ICSK, or IC35 and cultured for 72 h at 37°C. The counts were determined by [3H]TdR incorporation by proliferating cells. Error bars indicate the SD of triplicate samples. Data are representative of six–eight separate experiments. Statistical differences of biological significance are represented with an asterisk *p-value = <0.001. Bold font: These values are similar when compared to one another.](/cms/asset/1d53dfe8-14cf-4299-9f8b-42f21ab99655/koni_a_1238538_f0005_oc.jpg)
Table 4. IL2 bioactivity of IL2, ICp, IC35, and ICSK.
Figure 6. IC binding to cells expressing high or intermediate affinity IL2Rs. Flow cytometry analysis of IC binding on IL2R-expressing cells. (A) Tf-1β, (B) Kit225, (C) SCID splenocytes, and (D) CTLL-2. Cells (0.2 × 10⁶ cells/sample) were incubated with increasing amounts of the different ICs (ICp, IC35, or ICSK) in 0.2 mL of staining buffer for 30–60 min at 4°C. SCID splenocytes were pre-incubated with Mouse Fc block to minimize Fc receptor mediated binding of the ICs. For detection an Alexa fluor 647-conjugated goat anti-huIgG secondary mAb was used. MFI fold increase = (MFI of IC-stained sample/MFI of secondary mAb alone). Data represent the mean ± SD from three to five separate experiments. Statistical differences of significance are represented with an asterisk *p-value = <0.05 and **p-value = <0.01.
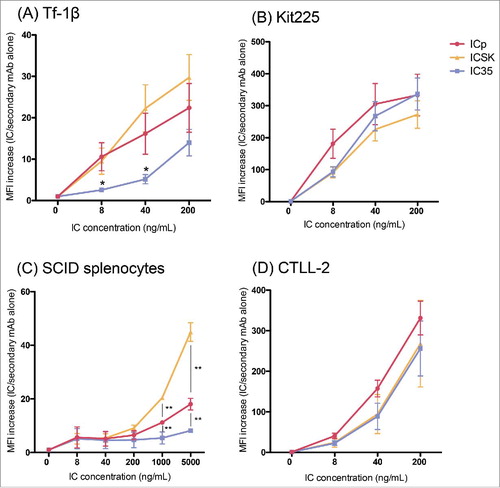
Figure 7. ICSK leads to increased IFNγ secretion on SCID splenocytes when compared to ICp. Comparison of IL2, ICp and ICSK induced secretion of interferon-γ on SCID splenocytes. Freshly isolated SCID splenocytes were stimulated with 7 μg/mL (equivalent to 1.3 × 10³ ng/mL IL2) ICp, IC35, or ICSK for 72 h at 37°C. Supernatants were harvested and secreted IFNγ was measured via flow cytometry using a colorimetric bead array. Error bars indicate SD of five samples. Data are representative of three separate experiments. Statistical differences of biological significance are represented with an asterisk *p-value = <0.05.
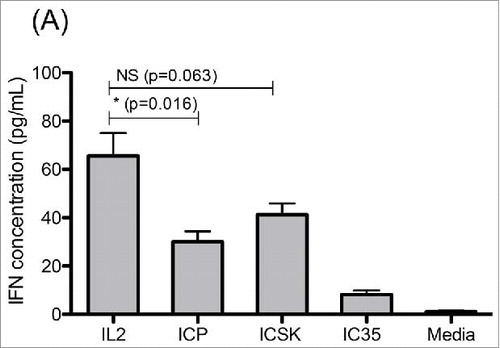
Figure 8. IC35 exhibits reduced phosphorylation of STAT5 via intermediate affinity IL2Rs. Comparison of IL2, ICp, IC35, and ICSK induced phosphorylation of STAT5 on: (A) Tf-1β and (B) Kit225. Cells were stimulated with increasing concentrations of IL2, ICp, ICSK, or IC35 and incubated for 15 min at 37°C. pSTAT5 levels were determined by intracellular flow cytometry staining using anti-pSTAT5(pY694). SI = (MFI stimulated cells/MFI unstimulated cells). Error bars indicate SD of triplicate samples. Data are representative of three separate experiments. Statistical differences of biological significance are represented with an asterisk *p-value = <0.05. SI, stimulation index; MFI, mean fluorescence intensity.
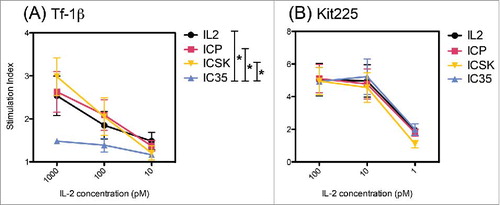
Figure 9. ADCC activity is not affected by moving the IL2 molecules to the light chains of the mAb. Comparison of ICp, IC35, and ICSK-mediated ADCC on: (A) Expanded NK cells and (B) PBMCs. Effector cells were co-incubated with 51Cr-loaded M21 tumor targets in the presence of 1 μg/mL (equivalent to 195 ng/mL IL2) ICp, IC35, or ICSK for 4 h at 37°C. Supernatants were harvested and the released 51Cr from lysed target cells was measured using a gamma counter. Percentage Cytotoxicity = [(experimental release − spontaneous release)/(maximum release − spontaneous Release)]×100. Error bars indicate SD of quadruplicate samples. Data are representative of three separate experiments.
![Figure 9. ADCC activity is not affected by moving the IL2 molecules to the light chains of the mAb. Comparison of ICp, IC35, and ICSK-mediated ADCC on: (A) Expanded NK cells and (B) PBMCs. Effector cells were co-incubated with 51Cr-loaded M21 tumor targets in the presence of 1 μg/mL (equivalent to 195 ng/mL IL2) ICp, IC35, or ICSK for 4 h at 37°C. Supernatants were harvested and the released 51Cr from lysed target cells was measured using a gamma counter. Percentage Cytotoxicity = [(experimental release − spontaneous release)/(maximum release − spontaneous Release)]×100. Error bars indicate SD of quadruplicate samples. Data are representative of three separate experiments.](/cms/asset/b197186f-0a51-47a1-85a1-1f31c84d43f4/koni_a_1238538_f0009_oc.jpg)
Table 5. Fold difference of the bioactivity of the ICs when compared to IL2.