1,153
Views
13
CrossRef citations to date
0
Altmetric
Original Research

T-helper cell receptors from long-term survivors after telomerase cancer vaccination for use in adoptive cell therapy

, , , , , , , , & show all
Article: e1249090 | Received 27 Jun 2016, Accepted 12 Oct 2016, Published online: 05 Dec 2016

Figures & data

Figure 1. Functional avidity and HLA restriction of GV1001-specific T-cell clones. T-cell clones from NSCLC patients C and D, both long-term survivors after GV1001 vaccination, were tested for proliferation after stimulation with irradiated EBV-transformed cells +/− GV1001 peptide. Panels (A)–(C) show mean cpm of triplicate wells. (A, B) Functional avidity of T-cell clones determined by titration of GV1001. (C) HLA restriction determined by blockage with mAbs against DP, DQ, or DP-molecules.
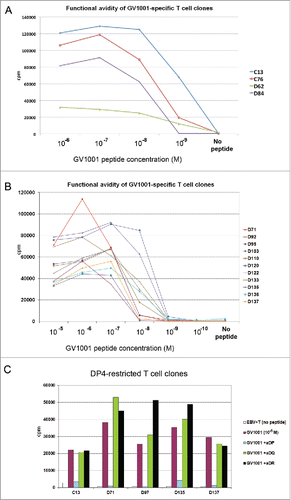
Figure 1. Functional avidity and HLA restriction of GV1001-specific T-cell clones. T-cell clones from NSCLC patients C and D, both long-term survivors after GV1001 vaccination, were tested for proliferation after stimulation with irradiated EBV-transformed cells +/− GV1001 peptide. Panels (A)–(C) show mean cpm of triplicate wells. (A, B) Functional avidity of T-cell clones determined by titration of GV1001. (C) HLA restriction determined by blockage with mAbs against DP, DQ, or DP-molecules.

Figure 2. Fine specificity of T-cell clones and recognition of naturally processed hTERT epitopes. T-cell clones from patients C and D were tested for proliferation after stimulation with irradiated EBV-transformed cells +/− antigen. Panels (A)–(C) show mean cpm of triplicate wells. (A) Fine specificity analysis by stimulation with truncated peptides covering the GV1001 sequence (aa sequences given in right text box). The core sequence recognized by each clone is different and highlighted (red) in text boxes bellow chart. (B, C) Recognition of naturally processed antigens. T-cell clones were stimulated with EBV-transformed cells incubated with a 173 aa recombinant hTERT protein fragment. The concentration of the protein fragment was titrated as indicated.
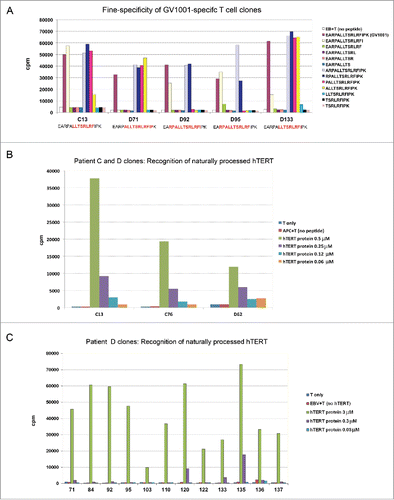
Figure 2. Fine specificity of T-cell clones and recognition of naturally processed hTERT epitopes. T-cell clones from patients C and D were tested for proliferation after stimulation with irradiated EBV-transformed cells +/− antigen. Panels (A)–(C) show mean cpm of triplicate wells. (A) Fine specificity analysis by stimulation with truncated peptides covering the GV1001 sequence (aa sequences given in right text box). The core sequence recognized by each clone is different and highlighted (red) in text boxes bellow chart. (B, C) Recognition of naturally processed antigens. T-cell clones were stimulated with EBV-transformed cells incubated with a 173 aa recombinant hTERT protein fragment. The concentration of the protein fragment was titrated as indicated.

Figure 3. Cytokine secretion by GV1001-specific T-cell clones monitored over 6 d. T-cell clones from immune responders in GV1001 vaccine trials were stimulated with irradiated EBV-transformed cells +/− peptide GV1001. Supernatants from duplicate cultures were collected each day for 6 d and analyzed by Bioplex cytokine assays. Panels (A) and (B) show data from T-cell clones from patient C. Panels (C) and (D) show T-cell clones from patient E. Mean cytokine concentrations (pg/mL) from cultures with peptide are displayed. The controls without peptide had only negligible cytokine levels for all T-cell clones at all time points, below 1% of the levels measured in cultures with peptide. IL-13 was measured at >90,000 pg/mL at all time points for T-cell clones C13, C76, and E 31 (A–C), and at 13,000–20,000 pg/mL for E35 (D). MIP-1b was measured at >30,000 pg/mL at all time points for all four T-cell clones.
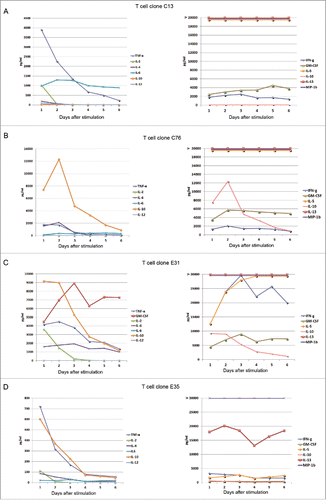
Figure 3. Cytokine secretion by GV1001-specific T-cell clones monitored over 6 d. T-cell clones from immune responders in GV1001 vaccine trials were stimulated with irradiated EBV-transformed cells +/− peptide GV1001. Supernatants from duplicate cultures were collected each day for 6 d and analyzed by Bioplex cytokine assays. Panels (A) and (B) show data from T-cell clones from patient C. Panels (C) and (D) show T-cell clones from patient E. Mean cytokine concentrations (pg/mL) from cultures with peptide are displayed. The controls without peptide had only negligible cytokine levels for all T-cell clones at all time points, below 1% of the levels measured in cultures with peptide. IL-13 was measured at >90,000 pg/mL at all time points for T-cell clones C13, C76, and E 31 (A–C), and at 13,000–20,000 pg/mL for E35 (D). MIP-1b was measured at >30,000 pg/mL at all time points for all four T-cell clones.

Figure 4. T-helper clones C13 and D71 respond to naturally processed hTERT epitopes with secretion of INFγ, TNFα, and CD107a. T-cell clones C13 and B71 were stimulated with irradiated EBV-transformed cells +/− peptide GV1001 or a 173 aa hTERT protein fragment. The cultures were incubated overnight and analyzed by flow cytometry. Top panels in (A) show INFγ/TNFα staining for clone C13. Bottom panels in (A) show INFγ/TNFα staining for clone D71. Panel (B) shows CD107 a secretion for clones C13 and D71. The bar chart (right) shows the percentage of CD107a+ T cells, as determined from the CD107a+ cell region indicated in the histograms.
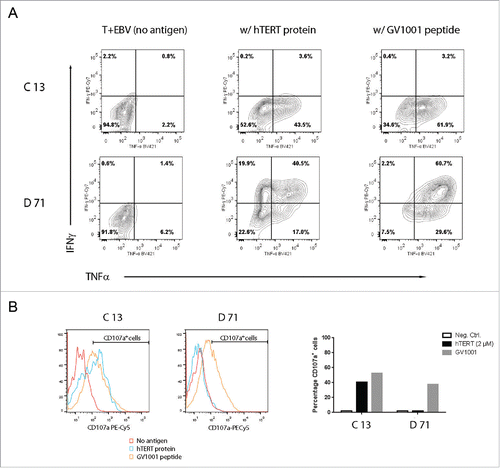
Figure 4. T-helper clones C13 and D71 respond to naturally processed hTERT epitopes with secretion of INFγ, TNFα, and CD107a. T-cell clones C13 and B71 were stimulated with irradiated EBV-transformed cells +/− peptide GV1001 or a 173 aa hTERT protein fragment. The cultures were incubated overnight and analyzed by flow cytometry. Top panels in (A) show INFγ/TNFα staining for clone C13. Bottom panels in (A) show INFγ/TNFα staining for clone D71. Panel (B) shows CD107 a secretion for clones C13 and D71. The bar chart (right) shows the percentage of CD107a+ T cells, as determined from the CD107a+ cell region indicated in the histograms.

Figure 5. TCR expression in SupT1 cells and binding to DP4/GV1001 tetramer. SupT1 T cells were transduced with TCR-C13_RQR8 or TCR-D71_RQR8 and analyzed by flow cytometry. The expression of TCR C13/D71 was measured with a mAb recognizing the murine constant beta region (mCb) incorporated in the TCRs. The expression of marker/suicide gene RQR8 was measured with the mAb QBen10. (A) Expression of D71_RQR8 in T cell line SupT1. Left and right plots show non-transduced and transduced cells, respectively. Percentage of cells in each quartile is given. A similar TCR and RQR8 expression was observed for TCR-C13_RQR8 (not shown). (B) SupT1 T cells transduced with TCR-C13_RQR8 or a control TCR (ctr TCR) were stained with an HLA-DP4 tetramer loaded with peptide GV1001. A HLA-DP4 tetramer with irrelevant peptide was included as negative control. Top part shows non-transduced cells. Bottom part shows transduced cells. The percentage of cells in each quartile is given.
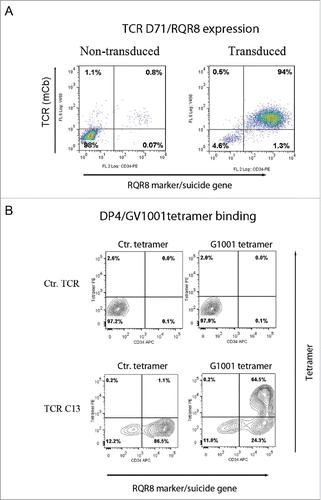
Figure 5. TCR expression in SupT1 cells and binding to DP4/GV1001 tetramer. SupT1 T cells were transduced with TCR-C13_RQR8 or TCR-D71_RQR8 and analyzed by flow cytometry. The expression of TCR C13/D71 was measured with a mAb recognizing the murine constant beta region (mCb) incorporated in the TCRs. The expression of marker/suicide gene RQR8 was measured with the mAb QBen10. (A) Expression of D71_RQR8 in T cell line SupT1. Left and right plots show non-transduced and transduced cells, respectively. Percentage of cells in each quartile is given. A similar TCR and RQR8 expression was observed for TCR-C13_RQR8 (not shown). (B) SupT1 T cells transduced with TCR-C13_RQR8 or a control TCR (ctr TCR) were stained with an HLA-DP4 tetramer loaded with peptide GV1001. A HLA-DP4 tetramer with irrelevant peptide was included as negative control. Top part shows non-transduced cells. Bottom part shows transduced cells. The percentage of cells in each quartile is given.

Figure 6. TCR expression in primary T-cells. PBMCs were transduced with TCR-C13_RQR8, TCR-D71_RQR8 or a control TCR and analyzed by flow cytometry. The expression of TCR C13/D71 was measured with a mAb recognizing the murine constant beta region (mCb) incorporated in the TCRs. The expression of marker/suicide gene RQR8 was measured with the mAb QBen10. The figure shows the expression of TCR C13_RQR8 and D71_RQR8 in CD4+ and CD8+ T cells. Left, middle, and right plots show cells transduced with the control TCR (ctr TCR), TCR C13, and TCR D71, respectively. The percentage of cells staining double positive for TCRmCb and RQR8 is given.
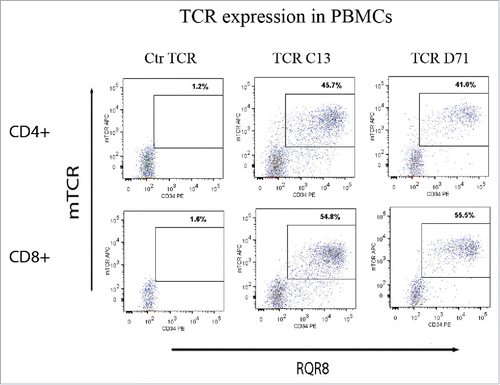
Figure 6. TCR expression in primary T-cells. PBMCs were transduced with TCR-C13_RQR8, TCR-D71_RQR8 or a control TCR and analyzed by flow cytometry. The expression of TCR C13/D71 was measured with a mAb recognizing the murine constant beta region (mCb) incorporated in the TCRs. The expression of marker/suicide gene RQR8 was measured with the mAb QBen10. The figure shows the expression of TCR C13_RQR8 and D71_RQR8 in CD4+ and CD8+ T cells. Left, middle, and right plots show cells transduced with the control TCR (ctr TCR), TCR C13, and TCR D71, respectively. The percentage of cells staining double positive for TCRmCb and RQR8 is given.

Figure 7. TCR transduced T-cells requires GV1001-specific functionality. Primary T cells were transduced with TCR C13_RQR8 or D71_RQR8. Transduced T cells and non-transduced control T cells were stimulated with irradiated EBV-transformed cells +/− hTERT peptide GV1001. The cultures were incubated overnight and analyzed by flow cytometry. Panels (A) and (B) show INFγ/TNFα staining for C13 and D71, respectively. Percentage of cells in each quartile is given. The transduced TCRs were derived from CD4+ T cells, but conferred GV1001-specific functionality to both CD4+ and CD8+ recipient cells. Panels (C) and (D) show cytotoxic activity of T cells transduced with C13 or D17, measured by use of CD107a and Granzyme B staining.
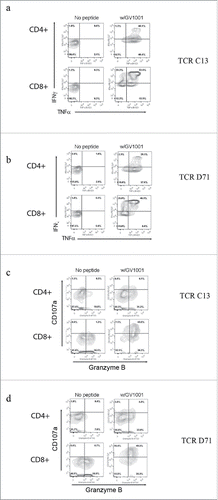
Figure 7. TCR transduced T-cells requires GV1001-specific functionality. Primary T cells were transduced with TCR C13_RQR8 or D71_RQR8. Transduced T cells and non-transduced control T cells were stimulated with irradiated EBV-transformed cells +/− hTERT peptide GV1001. The cultures were incubated overnight and analyzed by flow cytometry. Panels (A) and (B) show INFγ/TNFα staining for C13 and D71, respectively. Percentage of cells in each quartile is given. The transduced TCRs were derived from CD4+ T cells, but conferred GV1001-specific functionality to both CD4+ and CD8+ recipient cells. Panels (C) and (D) show cytotoxic activity of T cells transduced with C13 or D17, measured by use of CD107a and Granzyme B staining.

Reprints and Corporate Permissions

Please note: Selecting permissions does not provide access to the full text of the article, please see our help page How do I view content?

To request a reprint or corporate permissions for this article, please click on the relevant link below:

Academic Permissions

Please note: Selecting permissions does not provide access to the full text of the article, please see our help page How do I view content?

Obtain permissions instantly via Rightslink by clicking on the button below:

If you are unable to obtain permissions via Rightslink, please complete and submit this Permissions form. For more information, please visit our Permissions help page.