Figures & data
Figure 1. The frequency of intratumor NKG2A+ NK cells is increased in HCC. (A, B) The percentage of NKG2A-expressing NK cells in healthy livers (N = 17) and IT (N = 28) and PT (N = 25) from HCC patients. The differences in the cumulative data were calculated using a Kruskal–Wallis ANOVA followed by Dunn's multiple comparisons test. (C) NKG2A expression in NK cells from the paired IT and PT from each HCC patient (N = 23, Wilcoxon non-parametric statistical test). (D) The correlation between NKG2A expression in hepatic NK cells from IT and the serum AFP and ALT levels and tumor diameters of HCC patients. Spearman's correlation coefficients are shown.
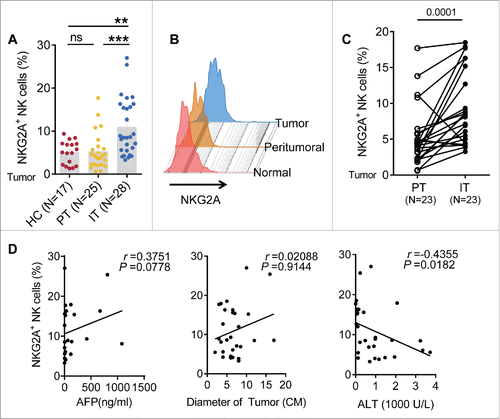
Figure 2. Functional impairment of intratumor NK cells from HCC patients. (A) TIL from PT (blue) and IT (yellow) were stimulated with IL-12, as described in the Materials and Methods. Intracellular IFNγ, CD107a, Granzyme B and perforin levels were determined using flow cytometry by gating on NK cells (CD3−CD56+) (Mann–Whitney non-parametric statistical test). (B) Analysis of the correlation between IFNγ levels and the percentage of NKG2A-expressing NK cells in the tissue samples. Each dot represents a single region (PT/IT) from an HCC patient (Spearman's correlation test). (C) The levels of IFNγ produced by NKG2A+ NK cells in IT and PT regions in paired HCC patients (Wilcoxon non-parametric statistical test). (D) Blood NK cells from the healthy controls were pre-incubated with medium alone or with PMA/ionomycin for 4 h. Intracellular IFNγ levels in NKG2A+ NK cells (Left) and NKG2A− NK cells (Right) were monitored via flow cytometry.
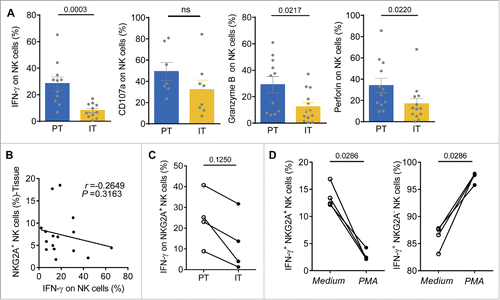
Figure 3. The density of NKG2A and its ligand are increased in the intratumoral regions from HCC patients. (A) Representative micrographs showing NKG2A+ (up) and HLA-E+ (down) cells in the peritumor tissue (right) and intratumor regions (left) of HCC patients. Original magnifications: 10×, 40×, bar = 100 μm. (B, C) Cumulative data are shown (Mann–Whitney non-parametric statistical tests). (D) A positive correlation was observed between integrated optical density (IOD)/area HLA-E+ cells and NKG2A expression (percentage by FACS) in intratumor NK cells from HCC patients (N = 11). Spearman's correlation coefficients (r) and p values are shown.
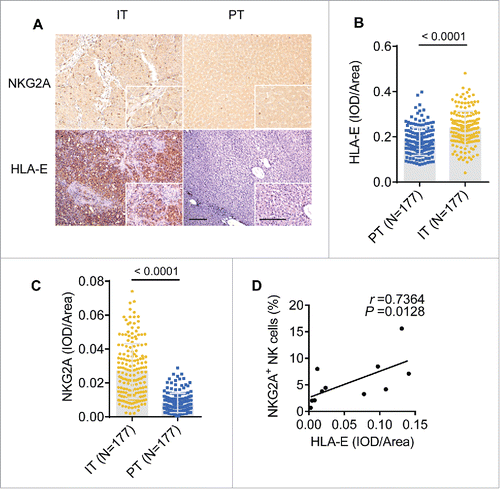
Figure 4. Shorter survival of patients with higher densities of HLA-E+ and NKG2A+ cells within tumors. (A, B) Correlations between DFS or OS and integrated optical density (IOD)/area of NKG2A+ cells in the IT regions of HCC patients (N = 177). Spearman's correlation coefficients (r) and p values are shown. (C–H) Kaplan–Meier survival curves for the duration of DFS (left) and OS (right) in months, according to the HLA-E+ cells density (C, D), NKG2A+ cells density (E, F) or both NKG2A+ and HLA-E+ cells density (G, H) in IT (low densities, red line; high densities, black line) (log-rank test).
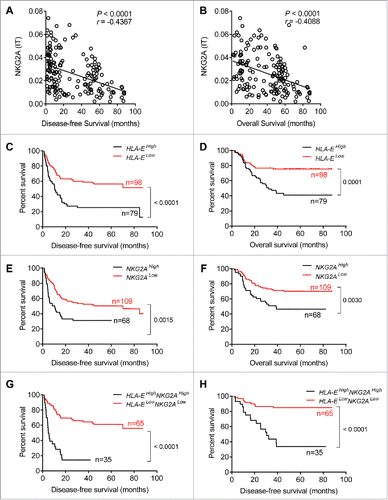
Figure 5. Soluble plasma IL-10 levels are associated with increased NKG2A expression in NK cells. (A) The plasma concentrations of IL-10 were detected in samples taken from healthy controls (N = 19) and HCC patients (N = 12) (Mann–Whitney non-parametric test). (B) Correlation between IL-10 expression and the percentage of NK cells expressing NKG2A in tissue samples from HCC patients (N = 9). Spearman's correlation coefficients are shown. (C) Blood NK cells from the healthy controls were pre-incubated with TGF-β or IL-10. NKG2A expression in NK cells was monitored at 72 h via flow cytometry. The histograms correspond to the NK cells from one representative donor treated with medium alone (red lines), TGF-β (1 ng/mL, blue lines) or IL-10 (1 ng/mL, orange lines; 10 ng/mL, green lines). (D) NKG2A expression on NK cells from each healthy controls pre-incubated with or without IL-10 (10 ng/mL) was monitored at 72 h by flow cytometry (Wilcoxon non-parametric statistical test). (E) NK cells from the healthy controls were cultured with medium alone, TGF-β, IL-10, plasma from HCC patients alone or an anti-IL-10 Ab or isotype control Ab for 3 d. NKG2A expression levels were analyzed via FACS. The differences in the cumulative data were calculated using a Friedman ANOVA followed by Dunn's multiple comparisons test.
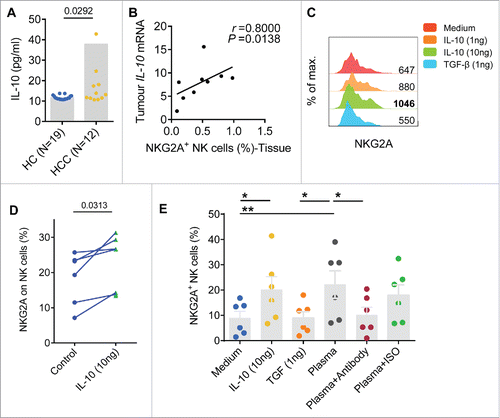
Figure 6. NKG2A expression is mainly increased in intratumor CD56dim NK cells from HCC patients. (A) The gating strategy for TIL used to analyze the CD56bright NK cells and CD56dim NK cells via flow cytometry. (B) The percentages of CD56bright NK cells and CD56dim NK cells from healthy livers (N = 17) and the IT (N = 28) and PT (N = 25) regions of HCC patients (Kruskal–Wallis ANOVA followed by Dunn's multiple comparisons test). (C) Representative NKG2A expression in different liver NK cell subsets from healthy controls (left) and intratumor (right) and PT from HCC patients (middle). (D) Cumulative data on the percentages of NKG2A+ CD56bright NK cells (left) and NKG2A+ CD56dim NK cells (right) from healthy livers (N = 17) and intratumor (N = 28) and PT (N = 25) from HCC patients (Kruskal–Wallis ANOVA followed by Dunn's multiple comparisons test). (E) The percentages of NKG2A+ CD56bright NK cells (left) and NKG2A+ CD56dim NK cells (right) in paired central tumor and PT from each HCC patient. (F) The proportion of NKG2A+ CD56bright NK cells (yellow) and NKG2A+ CD56dim NK cells (blue) among the total NKG2A+ NK cells from intratumor regions (right), PT (middle) and healthy livers (left).
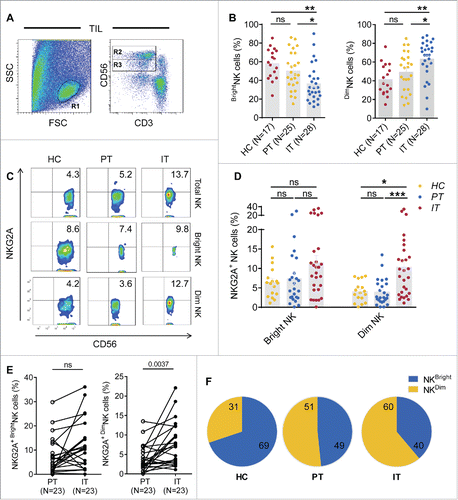
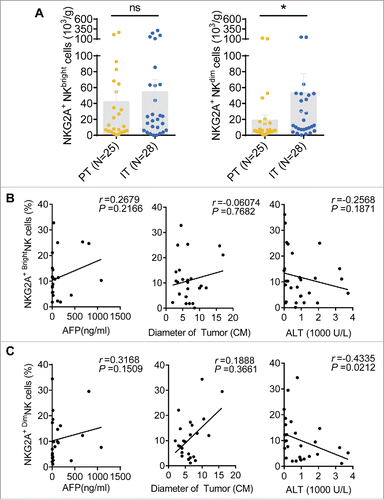
Figure 7. Correlations between the percentages of different NKG2A+ NK cell subsets and the clinical characteristics of patients with HCC. (A) The absolute number of NKG2A+CD56bright NK cells (left) or NKG2A+CD56dim NK cells (right) in per gram IT tissues (N = 28) and PT tissues (N = 25) from HCC patients. Cumulative data are shown (Mann–Whitney non-parametric test). Correlations between NKG2A expressions in CD56bright NK cells (B) or CD56dim NK cells (C) and AFP and ALT levels and tumor diameters. Each dot represents a single patient. Spearman's correlation coefficients are shown.