3,389
Views
86
CrossRef citations to date
0
Altmetric
Original Research

Impact of (chemo)radiotherapy on immune cell composition and function in cervical cancer patients

, , , , , , , ORCID Icon, , , , & show all
Article: e1267095 | Received 14 Oct 2016, Accepted 24 Nov 2016, Published online: 07 Feb 2017

Figures & data

Table 1. Clinical and tumor characteristics of patients.

Figure 1. Treatment and blood sampling schedule. Blood samples 1–5: blood samples for immunomonitoring. Numbers above the blood samples indicate the amount of patients who provided blood for immunomonitoring. Abbreviations: EBRT = external beam radiation therapy; ChTh = chemotherapy; BT = brachytherapy.
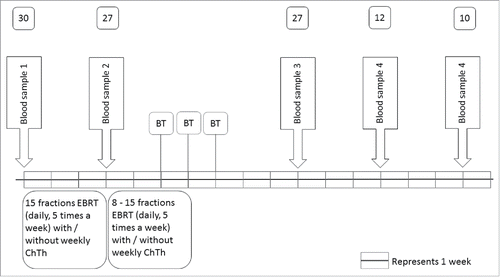
Figure 1. Treatment and blood sampling schedule. Blood samples 1–5: blood samples for immunomonitoring. Numbers above the blood samples indicate the amount of patients who provided blood for immunomonitoring. Abbreviations: EBRT = external beam radiation therapy; ChTh = chemotherapy; BT = brachytherapy.

Figure 2. (Chemo)radiotherapy induced reduction in the absolute numbers of leukocytes and lymphocytes. (A) Time course of changes in the absolute number of leukocytes and lymphocytes before (baseline) treatment and during the first 5 d of fractionized radiotherapy. (B) Time course of changes in absolute number of leukocytes and lymphocytes before (baseline), during (15 fractions) and after (chemo)radiotherapy (3, 6 and 9 weeks after completion). Data are expressed as means ± SD, *p < 0.05. Abbreviations: fract = fractions; wks = weeks.
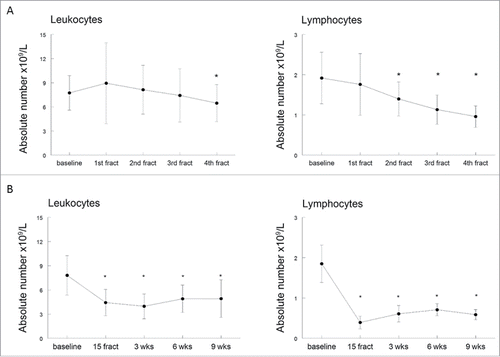
Figure 2. (Chemo)radiotherapy induced reduction in the absolute numbers of leukocytes and lymphocytes. (A) Time course of changes in the absolute number of leukocytes and lymphocytes before (baseline) treatment and during the first 5 d of fractionized radiotherapy. (B) Time course of changes in absolute number of leukocytes and lymphocytes before (baseline), during (15 fractions) and after (chemo)radiotherapy (3, 6 and 9 weeks after completion). Data are expressed as means ± SD, *p < 0.05. Abbreviations: fract = fractions; wks = weeks.

Figure 3. The effect of (chemo)radiotherapy on T-cell reactivity. The response of circulating T cells against memory response mix (MRM; black bars) and influenza M1 protein-derived peptides (FLU; white bars) was measured in the lymphocyte stimulation test (LST). T cell proliferation is expressed as stimulation index + standard error of the mean (SEM) and shown at different time points, including baseline, after 15 fractions of EBRT and 3, 6 and 9 weeks after completion of EBRT. Data were analyzed by mixed model and expressed as means + SEM. *p <0.05 with respect to baseline. Abbreviations: wks = weeks; fract = fractions.
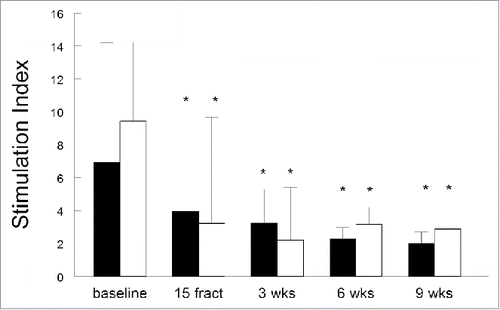
Figure 3. The effect of (chemo)radiotherapy on T-cell reactivity. The response of circulating T cells against memory response mix (MRM; black bars) and influenza M1 protein-derived peptides (FLU; white bars) was measured in the lymphocyte stimulation test (LST). T cell proliferation is expressed as stimulation index + standard error of the mean (SEM) and shown at different time points, including baseline, after 15 fractions of EBRT and 3, 6 and 9 weeks after completion of EBRT. Data were analyzed by mixed model and expressed as means + SEM. *p <0.05 with respect to baseline. Abbreviations: wks = weeks; fract = fractions.

Figure 4. (Chemo)radiotherapy impairs the ability of antigen presenting cells to stimulate allogeneic T cells. Antigen presenting capacity of PBMCs as determined in a mixed lymphocyte reaction (MLR) in the blood samples from 10 patients are plotted over time. Treatment-induced changes in lymphocyte reactions as observed in the MLR based on (A) stimulation index (S.I.), expressed as mean ± SEM and (B) expressed as the fold changes (mean + SEM) of these S.I. over baseline. Time point include baseline, after 15 fractions of EBRT and at 3, 6 and 9 weeks after completion of EBRT. *p <0.05 with respect to baseline. Abbreviations: wks = weeks; fract = fractions.
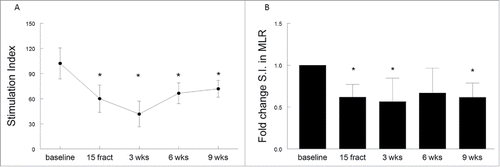
Figure 4. (Chemo)radiotherapy impairs the ability of antigen presenting cells to stimulate allogeneic T cells. Antigen presenting capacity of PBMCs as determined in a mixed lymphocyte reaction (MLR) in the blood samples from 10 patients are plotted over time. Treatment-induced changes in lymphocyte reactions as observed in the MLR based on (A) stimulation index (S.I.), expressed as mean ± SEM and (B) expressed as the fold changes (mean + SEM) of these S.I. over baseline. Time point include baseline, after 15 fractions of EBRT and at 3, 6 and 9 weeks after completion of EBRT. *p <0.05 with respect to baseline. Abbreviations: wks = weeks; fract = fractions.

Figure 5. (Chemo)radiotherapy alters the relative frequencies of circulating myeloid and lymphoid cells. (A) Percentages of lymphoid cells (CD3+CD19) and myeloid cells (CD3CD19) of viable cells as measured by flow cytometry. Mean percentages are shown for 10 patients with a complete follow-up at different time points, including baseline, after 15 fractions of EBRT and at 3, 6 or 9 weeks after completion of EBRT. Percentage are expressed as mean ± SD. (B) Fold changes in lymphoid and myeloid cells over baseline. Fold changes are expressed as mean + SEM; *p <0.05 with respect to baseline. Abbreviations: wks = weeks; fract = fractions.
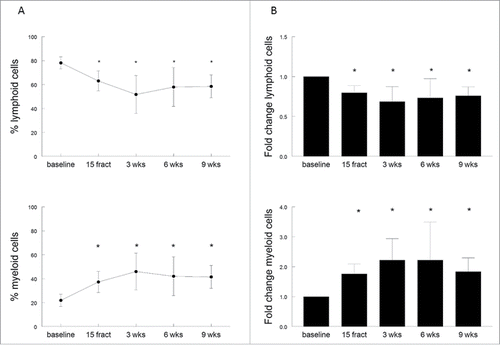
Figure 5. (Chemo)radiotherapy alters the relative frequencies of circulating myeloid and lymphoid cells. (A) Percentages of lymphoid cells (CD3+CD19−) and myeloid cells (CD3−CD19−) of viable cells as measured by flow cytometry. Mean percentages are shown for 10 patients with a complete follow-up at different time points, including baseline, after 15 fractions of EBRT and at 3, 6 or 9 weeks after completion of EBRT. Percentage are expressed as mean ± SD. (B) Fold changes in lymphoid and myeloid cells over baseline. Fold changes are expressed as mean + SEM; *p <0.05 with respect to baseline. Abbreviations: wks = weeks; fract = fractions.

Figure 6. (Chemo)radiotherapy induces CD4+ T-cell suppression via PD-1. (A) Percentage of PD-1+ expressing CD4+ T cells for individual patients. (B) Aggregated fold changes of percentages with respect to baseline, *p <0.05 with respect to baseline. (C, D) Stimulation of five baseline PBMC samples with influenza Matrix 1 protein-derived peptides (FLU) in vitro in the presence (white bars) or absence (black bars) of PD-1 blocking using 1 μg/mL Nivolumab. (E, F) Stimulation of three post-treatment samples with FLU in vitro in the presence (white bars) or absence (black bars) of PD-1 blocking with 1 μg/mL Nivolumab. Displayed in (C) and (E) is the proliferation, expressed as counts per minute (cpm), shown as mean of triplicate wells plus standard deviation after stimulation. (D, F) Cytokine IFNγ production as measured within the supernatant of the proliferation assay, with and without PD-1 blocking. Abbreviations: wks = weeks; fract = fractions; cpm = counts per minute.
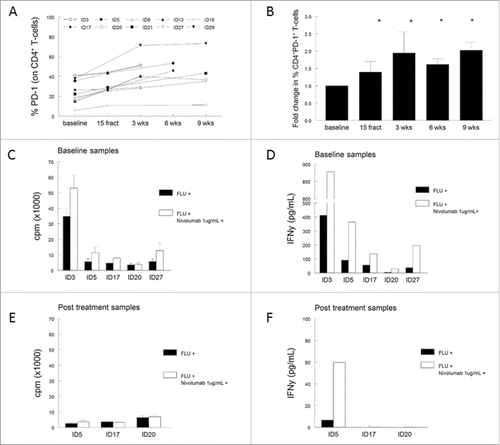
Figure 6. (Chemo)radiotherapy induces CD4+ T-cell suppression via PD-1. (A) Percentage of PD-1+ expressing CD4+ T cells for individual patients. (B) Aggregated fold changes of percentages with respect to baseline, *p <0.05 with respect to baseline. (C, D) Stimulation of five baseline PBMC samples with influenza Matrix 1 protein-derived peptides (FLU) in vitro in the presence (white bars) or absence (black bars) of PD-1 blocking using 1 μg/mL Nivolumab. (E, F) Stimulation of three post-treatment samples with FLU in vitro in the presence (white bars) or absence (black bars) of PD-1 blocking with 1 μg/mL Nivolumab. Displayed in (C) and (E) is the proliferation, expressed as counts per minute (cpm), shown as mean of triplicate wells plus standard deviation after stimulation. (D, F) Cytokine IFNγ production as measured within the supernatant of the proliferation assay, with and without PD-1 blocking. Abbreviations: wks = weeks; fract = fractions; cpm = counts per minute.
Supplemental material

Supplementary_materials.zip

Download Zip (1.1 MB)