2,736
Views
45
CrossRef citations to date
0
Altmetric
Original Research

Targeting cytokine signaling checkpoint CIS activates NK cells to protect from tumor initiation and metastasis

, , , , , , ORCID Icon, , & show all
Article: e1267892 | Received 02 Sep 2016, Accepted 24 Nov 2016, Published online: 07 Feb 2017

Figures & data

Figure 1. Loss of Cish controls tumor metastasis. (A, B) Groups of 20 B6.WT (Cish+/+) and 21 B6.Cish−/− mice were injected i.v. with either 2 × 10⁵ B16F10 melanoma or RM-1 prostate carcinoma cells. (A) Lungs were harvested on day 14 and macrometastases were counted. Shown is the mean ± SEM of 10 mice per group. (B) The survival of 10–11 mice per group is plotted. (C) Groups of five B6.WT (Cish+/+) and B6.Cish−/− mice were injected i.v. with 2 × 10⁵ RM-1 prostate carcinoma cells and treated on days −1, 0, and 7 relative to tumor inoculation with either control Ig (cIg), 100 μg anti-CD8β (CD8+ T cell depletion), 50 μg anti-asialoGM1 (anti-asGM1; NK cell depletion), or 250  μg anti-IFN-γ antibodies. Lungs were harvested on day 14 and macrometastases were counted. Shown is the mean ± SEM of five mice per group. Statistically significant differences between WT and Cish−/− groups as indicated were determined by (A) the Mann–Whitney U test, (B) the Log-rank Mantel–Cox test, and (C) one-way ANOVA with the Tukey post-test (for multiple comparisons) (*p < 0.05; ***p < 0.001; ****p < 0.0001).
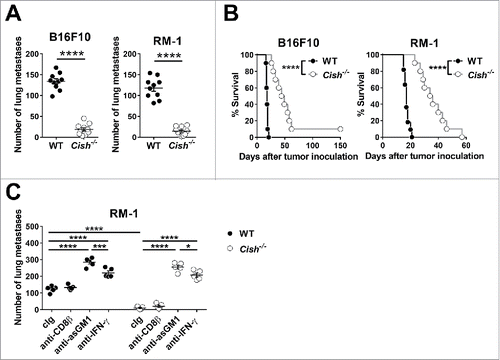
Figure 1. Loss of Cish controls tumor metastasis. (A, B) Groups of 20 B6.WT (Cish+/+) and 21 B6.Cish−/− mice were injected i.v. with either 2 × 10⁵ B16F10 melanoma or RM-1 prostate carcinoma cells. (A) Lungs were harvested on day 14 and macrometastases were counted. Shown is the mean ± SEM of 10 mice per group. (B) The survival of 10–11 mice per group is plotted. (C) Groups of five B6.WT (Cish+/+) and B6.Cish−/− mice were injected i.v. with 2 × 10⁵ RM-1 prostate carcinoma cells and treated on days −1, 0, and 7 relative to tumor inoculation with either control Ig (cIg), 100 μg anti-CD8β (CD8+ T cell depletion), 50 μg anti-asialoGM1 (anti-asGM1; NK cell depletion), or 250  μg anti-IFN-γ antibodies. Lungs were harvested on day 14 and macrometastases were counted. Shown is the mean ± SEM of five mice per group. Statistically significant differences between WT and Cish−/− groups as indicated were determined by (A) the Mann–Whitney U test, (B) the Log-rank Mantel–Cox test, and (C) one-way ANOVA with the Tukey post-test (for multiple comparisons) (*p < 0.05; ***p < 0.001; ****p < 0.0001).

Figure 2. Cish-deficient mice are protected from MCA-induced tumor development. (A) Groups of 15 B6.WT (Cish+/+) and 18 B6.Cish−/− male mice were inoculated s.c. in the hind flank with 300 µg of MCA in 0.1 mL of corn oil. Mice were then monitored for fibrosarcoma development over 250 d, and data were recorded as the percentage tumor free mice (tumors > 3 mm in diameter were recorded as positive). (B) Groups of 16–18 B6.WT (Cish+/+) and 14 B6.Cish−/− male mice were inoculated s.c. in the hind flank with 300 µg of MCA in 0.1 mL of corn oil. Mice were treated with either 250 μg hamster cIg, 50 μg anti-asialoGM1 (anti-asGM1; NK cell depletion) or 250 μg anti-IFN-γ antibodies injected i.p. on days −1, 0, 7, 12, 24, 28, 35, and 42. Mice were monitored for fibrosarcoma development over 200 d. Tumors were measured every week with a caliper square as the product of two perpendicular diameters (mm2). Mice were euthanized when the tumor reached > 150 mm2 in square diameter. Statistically significant survival differences between the groups were determined by the Log-rank Mantel–Cox test (A) followed by the Bonferroni correction for multiple testing (B) (*p < 0.05; ***p < 0.001; ****p < 0.0001).

Figure 2. Cish-deficient mice are protected from MCA-induced tumor development. (A) Groups of 15 B6.WT (Cish+/+) and 18 B6.Cish−/− male mice were inoculated s.c. in the hind flank with 300 µg of MCA in 0.1 mL of corn oil. Mice were then monitored for fibrosarcoma development over 250 d, and data were recorded as the percentage tumor free mice (tumors > 3 mm in diameter were recorded as positive). (B) Groups of 16–18 B6.WT (Cish+/+) and 14 B6.Cish−/− male mice were inoculated s.c. in the hind flank with 300 µg of MCA in 0.1 mL of corn oil. Mice were treated with either 250 μg hamster cIg, 50 μg anti-asialoGM1 (anti-asGM1; NK cell depletion) or 250 μg anti-IFN-γ antibodies injected i.p. on days −1, 0, 7, 12, 24, 28, 35, and 42. Mice were monitored for fibrosarcoma development over 200 d. Tumors were measured every week with a caliper square as the product of two perpendicular diameters (mm2). Mice were euthanized when the tumor reached > 150 mm2 in square diameter. Statistically significant survival differences between the groups were determined by the Log-rank Mantel–Cox test (A) followed by the Bonferroni correction for multiple testing (B) (*p < 0.05; ***p < 0.001; ****p < 0.0001).

Figure 3. Lack of Cish does not have a major impact on the surveillance of lymphoma. (A) Groups of 10 B6.WT (Cish+/+) and B6.Cish−/− mice were injected i.p. with 5 × 10⁴ luciferase+ RMA-S cells. Mice were monitored for tumor development by in vivo imaging (see Fig. S3). The Kaplan–Meier plot summarizes two independent experiments (p = 0.22; Log-rank Mantel–Cox test). (B) Groups of 10 B6.WT (Cish+/+) and B6.Cish−/− mice were injected i.p. with 1 × 10⁴ parental RMA-S cells. Mice were monitored for tumor development and were euthanized at the point of abdominal swelling and discomfort. The Kaplan–Meier plot shows survival curves of WT and Cish−/− mice (p = 0.96; Log-rank Mantel–Cox test) (C, D) Groups of 9–10 B6.WT (Cish+/+) and B6.Cish−/− mice were injected s.c. with 1×10⁶ RMA-S-Rae1β cells. Tumors were measured every 2–3 d with a caliper square as the product of two perpendicular diameters (mm2). Shown are (C) the tumor growth curves of individual mice and (D) the rejection rate summarized from two independent experiments.
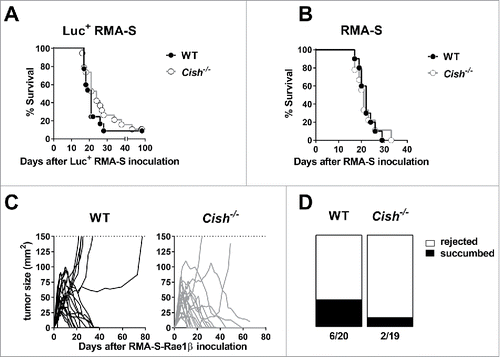
Figure 3. Lack of Cish does not have a major impact on the surveillance of lymphoma. (A) Groups of 10 B6.WT (Cish+/+) and B6.Cish−/− mice were injected i.p. with 5 × 10⁴ luciferase+ RMA-S cells. Mice were monitored for tumor development by in vivo imaging (see Fig. S3). The Kaplan–Meier plot summarizes two independent experiments (p = 0.22; Log-rank Mantel–Cox test). (B) Groups of 10 B6.WT (Cish+/+) and B6.Cish−/− mice were injected i.p. with 1 × 10⁴ parental RMA-S cells. Mice were monitored for tumor development and were euthanized at the point of abdominal swelling and discomfort. The Kaplan–Meier plot shows survival curves of WT and Cish−/− mice (p = 0.96; Log-rank Mantel–Cox test) (C, D) Groups of 9–10 B6.WT (Cish+/+) and B6.Cish−/− mice were injected s.c. with 1×10⁶ RMA-S-Rae1β cells. Tumors were measured every 2–3 d with a caliper square as the product of two perpendicular diameters (mm2). Shown are (C) the tumor growth curves of individual mice and (D) the rejection rate summarized from two independent experiments.

Figure 4. Cish deficiency does not significantly alter the progression of multiple myeloma. (A) Groups of 10 B6.WT (Cish+/+) and 10–11 B6.Cish−/− mice were injected i.v. with 2 × 10⁶ Vk12653 multiple myeloma cells. Blood was drawn 3 and 5 weeks after tumor transplantation and serum γ-globulin levels were determined. Shown is the median ± interquartile range of 20–21 mice per group summarizing two independent experiments. (B) Groups of 10 B6.WT (Cish+/+) and 11 B6.Cish−/− mice were euthanized after 5 weeks and the spleen weights were documented. The infiltration of multiple myeloma cells (gated on B220CD138+CD155+ cells) into (C) spleen and (D) bone marrow was analyzed by flow cytometry. Shown is the median ± interquartile range of 10–11 mice per group. The differences were not significant as determined by the Mann–Whitney U test. (E) Groups of 10 B6.WT (Cish+/+) and 10 B6.Cish−/− mice were injected i.v. with 2 × 10⁶ Vk12653 multiple myeloma cells and treated on days −1, 0, 6, 13, 20, and 28 relative to tumor inoculation with either 100 μg rabbit Ig (cIg) or anti-asialoGM1 (anti-asGM1; NK cell depletion). Statistically significant differences in survival were determined by the Log-rank Mantel–Cox test followed by Bonferroni correction for multiple testing (***p < 0.001).
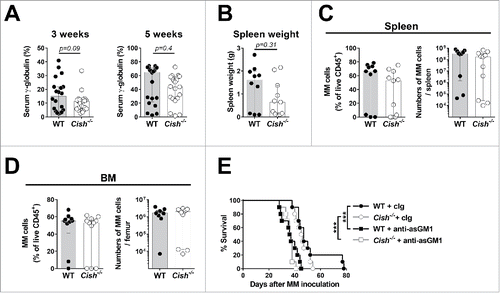
Figure 4. Cish deficiency does not significantly alter the progression of multiple myeloma. (A) Groups of 10 B6.WT (Cish+/+) and 10–11 B6.Cish−/− mice were injected i.v. with 2 × 10⁶ Vk12653 multiple myeloma cells. Blood was drawn 3 and 5 weeks after tumor transplantation and serum γ-globulin levels were determined. Shown is the median ± interquartile range of 20–21 mice per group summarizing two independent experiments. (B) Groups of 10 B6.WT (Cish+/+) and 11 B6.Cish−/− mice were euthanized after 5 weeks and the spleen weights were documented. The infiltration of multiple myeloma cells (gated on B220−CD138+CD155+ cells) into (C) spleen and (D) bone marrow was analyzed by flow cytometry. Shown is the median ± interquartile range of 10–11 mice per group. The differences were not significant as determined by the Mann–Whitney U test. (E) Groups of 10 B6.WT (Cish+/+) and 10 B6.Cish−/− mice were injected i.v. with 2 × 10⁶ Vk12653 multiple myeloma cells and treated on days −1, 0, 6, 13, 20, and 28 relative to tumor inoculation with either 100 μg rabbit Ig (cIg) or anti-asialoGM1 (anti-asGM1; NK cell depletion). Statistically significant differences in survival were determined by the Log-rank Mantel–Cox test followed by Bonferroni correction for multiple testing (***p < 0.001).

Figure 5. T cell-mediated control of tumors does not appear CIS dependent. Groups of 10 B6.WT (Cish+/+) and B6.Cish−/− mice were injected s.c. in the hind flank with (A) 1 × 10⁵ B16F10, (B) 1 × 10⁵ B16-OVA, (C) 1 × 10⁶ MC38-OVA, or (D, E) 1 × 10⁶ MCA1956 cells. Tumors were measured every 2–3 d with a caliper square as the product of two perpendicular diameters (mm2). (A–D) Shown is the mean ± SEM of 10 mice per group. (E) Groups of 6–7 B6.WT (Cish+/+) and B6.Cish−/− mice were injected s.c. with 1 × 10⁶ MCA1956 fibrosarcoma cells and treated on days −1, 0, 7, and 14 relative to tumor inoculation with either control Ig (cIg: 50 μg rabbit IgG plus 100 μg rat IgG1), 50 μg anti-asialoGM1 (anti-asGM1; NK cell depletion) or 100 μg anti-CD8β (CD8+ T cell depletion). Shown is the mean ± SEM of 6–7 mice per group. Statistically significant differences between WT and Cish−/− groups as indicated were determined by the Mann–Whitney U test (*p < 0.05).
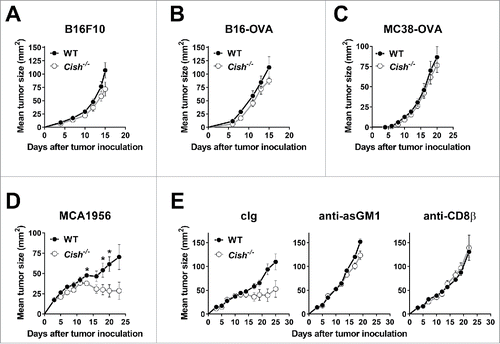
Figure 5. T cell-mediated control of tumors does not appear CIS dependent. Groups of 10 B6.WT (Cish+/+) and B6.Cish−/− mice were injected s.c. in the hind flank with (A) 1 × 10⁵ B16F10, (B) 1 × 10⁵ B16-OVA, (C) 1 × 10⁶ MC38-OVA, or (D, E) 1 × 10⁶ MCA1956 cells. Tumors were measured every 2–3 d with a caliper square as the product of two perpendicular diameters (mm2). (A–D) Shown is the mean ± SEM of 10 mice per group. (E) Groups of 6–7 B6.WT (Cish+/+) and B6.Cish−/− mice were injected s.c. with 1 × 10⁶ MCA1956 fibrosarcoma cells and treated on days −1, 0, 7, and 14 relative to tumor inoculation with either control Ig (cIg: 50 μg rabbit IgG plus 100 μg rat IgG1), 50 μg anti-asialoGM1 (anti-asGM1; NK cell depletion) or 100 μg anti-CD8β (CD8+ T cell depletion). Shown is the mean ± SEM of 6–7 mice per group. Statistically significant differences between WT and Cish−/− groups as indicated were determined by the Mann–Whitney U test (*p < 0.05).

Figure 6. Cish−/− mice respond as WT mice to LPS challenge. Groups of five B6.WT (Cish+/+) and B6.Cish−/− mice were injected i.p. with 0.2, 0.5, or 1 mg LPS/30 g mouse as indicated. (A) The weight loss and recovery upon injection of low dose LPS and (B) the survival of B6.WT and B6.Cish−/− mice upon the injection of high dose LPS was similar. Shown is the mean ± SEM of five mice per group. (C) Six hours after the injection of 0.2 mg LPS/30 g mouse, spleens were analyzed for the presence (fraction and absolute numbers) and activation (expression of CD122, CD69, and IFN-γ) of NK cells by flow cytometry (gated on live CD45+TCRβNK1.1+DX5+NKp46+). Naive B6.WT (Cish+/+) and B6.Cish−/− mice were used as untreated control. Shown is the summary of two independent experiments represented by the median ± interquartile range of four to six naïve and 10 LPS-challenged mice per group. Statistically significant differences between WT and Cish−/− groups as indicated were determined by one-way ANOVA with the Tukey post-test (*p < 0.05; **p < 0.01; ****p < 0.0001). (D) Serum cytokine levels were determined 7 d before (time point 0), and 1, 3, and 6 h after i.p. injection of 0.2 mg LPS/30 g mouse. Shown is the summary of two independent experiments represented by the mean ± SEM of 10 mice per group.
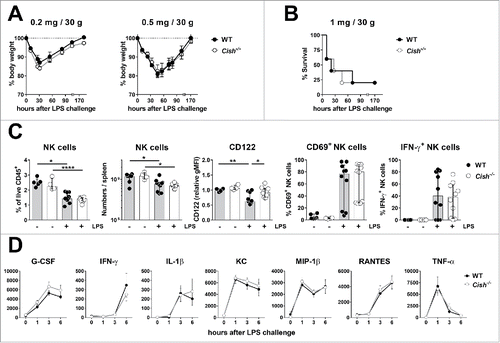
Figure 6. Cish−/− mice respond as WT mice to LPS challenge. Groups of five B6.WT (Cish+/+) and B6.Cish−/− mice were injected i.p. with 0.2, 0.5, or 1 mg LPS/30 g mouse as indicated. (A) The weight loss and recovery upon injection of low dose LPS and (B) the survival of B6.WT and B6.Cish−/− mice upon the injection of high dose LPS was similar. Shown is the mean ± SEM of five mice per group. (C) Six hours after the injection of 0.2 mg LPS/30 g mouse, spleens were analyzed for the presence (fraction and absolute numbers) and activation (expression of CD122, CD69, and IFN-γ) of NK cells by flow cytometry (gated on live CD45+TCRβ−NK1.1+DX5+NKp46+). Naive B6.WT (Cish+/+) and B6.Cish−/− mice were used as untreated control. Shown is the summary of two independent experiments represented by the median ± interquartile range of four to six naïve and 10 LPS-challenged mice per group. Statistically significant differences between WT and Cish−/− groups as indicated were determined by one-way ANOVA with the Tukey post-test (*p < 0.05; **p < 0.01; ****p < 0.0001). (D) Serum cytokine levels were determined 7 d before (time point 0), and 1, 3, and 6 h after i.p. injection of 0.2 mg LPS/30 g mouse. Shown is the summary of two independent experiments represented by the mean ± SEM of 10 mice per group.

Figure 7. Cish−/− mice respond similarly to WT mice to CpG challenge. Groups of 5 B6.WT (Cish+/+) and B6.Cish−/− mice were injected i.p. with 0.1 mg CpG/30 g mouse. (A) Six hours after the injection of CpG, spleens were analyzed for the presence (fraction and absolute numbers) and activation (expression of CD122, CD69, and IFN-γ) of NK cells by flow cytometry (gated on live CD45+TCRβNK1.1+DX5+NKp46+). Three naïve B6.WT (Cish+/+) and B6.Cish−/− mice were used as untreated control. Shown is the summary of two independent experiments represented by the median ± interquartile range of 10 mice per group. Statistically significant differences between WT and Cish−/− groups as indicated were determined by one-way ANOVA with the Tukey post-test (*p < 0.05; **p < 0.01; ***p < 0.001). (B) Serum cytokine levels were determined 10 d before (time point 0), and 1, 3, and 6 h after the i.p. injection of CpG. Shown is the summary of two independent experiments represented by the mean ± SEM of 10 mice per group. Statistically significant differences between WT and Cish−/− groups as indicated were determined by the Mann–Whitney U test (*p < 0.05).
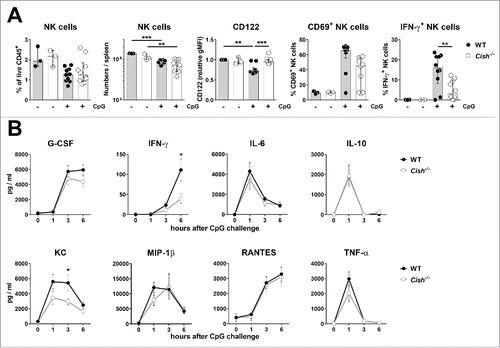
Figure 7. Cish−/− mice respond similarly to WT mice to CpG challenge. Groups of 5 B6.WT (Cish+/+) and B6.Cish−/− mice were injected i.p. with 0.1 mg CpG/30 g mouse. (A) Six hours after the injection of CpG, spleens were analyzed for the presence (fraction and absolute numbers) and activation (expression of CD122, CD69, and IFN-γ) of NK cells by flow cytometry (gated on live CD45+TCRβ−NK1.1+DX5+NKp46+). Three naïve B6.WT (Cish+/+) and B6.Cish−/− mice were used as untreated control. Shown is the summary of two independent experiments represented by the median ± interquartile range of 10 mice per group. Statistically significant differences between WT and Cish−/− groups as indicated were determined by one-way ANOVA with the Tukey post-test (*p < 0.05; **p < 0.01; ***p < 0.001). (B) Serum cytokine levels were determined 10 d before (time point 0), and 1, 3, and 6 h after the i.p. injection of CpG. Shown is the summary of two independent experiments represented by the mean ± SEM of 10 mice per group. Statistically significant differences between WT and Cish−/− groups as indicated were determined by the Mann–Whitney U test (*p < 0.05).

Figure 8. Combining Cish deficiency and checkpoint inhibitors or cytokine stimulation shows an improved anti-metastatic effect. (A) Groups of 5–6 B6.WT (Cish+/+) or B6.Cish−/− mice were injected i.v. with 2 × 10⁵ B16F10 melanoma cells and treated with either control Ig (cIg) (250 μg i.p. on days 0, 3, and 6), anti-PD-1 (250 μg i.p. on days 0, 3, and 6), mouse IFN-αβ (25 μg i.p. on days 0, 1, 2, and 3) or recombinant IL-2 (10,000 IU i.p. on days 0, 1, 2, and 3). (B) Groups of 5–11 B6.WT (Cish+/+) or B6.Cish−/− mice were injected i.v. with 7.5 × 10⁵ B16F10 melanoma cells and treated with either cIg (250 μg i.p. on days 0, 3, and 6), anti-PD1/anti-CTLA-4 combination (250 μg i.p. each on days 0, 3, and 6), or recombinant IL-2 (10,000 IU i.p. on days 0, 1, 2, 3, and 4). (C) Groups of 7–10 B6.WT (Cish+/+) and B6.Cish−/− mice were injected i.p. with 1 × 10⁵ parental RMA-S cells and treated with either PBS or recombinant IL-2 (100,000 IU i.p. on days 0, 1, 2, 3, and 4). Mice were monitored for tumor development and were euthanized at the point of abdominal swelling and discomfort. Improved survival between groups was assessed by the Log-rank Mantel–Cox test. (D) Groups of 5–15 B6.WT (Cish+/+) or B6.Cish−/− mice were injected i.v. with 5×10⁵ RM-1 prostate carcinoma cells and treated with either cIg, anti-CD96, anti-PD-1, anti-CTLA-4, or anti-PD1/anti-CTLA-4 combination (250 μg i.p. each on days 0 and 3). (E) Groups of 8–10 B6.WT (Cish+/+) or B6.Cish−/− mice were injected i.v. with 7.5×10⁵ B16F10 melanoma cells and treated with either 250 μg cIg or anti-CD96 mAb (i.p. on days 0 and 3). (F) Groups of 5–6 B6.WT (Cish+/+) or B6.Cish−/− mice were injected i.v. with 7.5 × 10⁵ LWT1 melanoma cells and treated with either vehicle or PLX4720 (10 mg/kg i.p., daily from days 0 to 6). Lungs were harvested on (A, D, F) day 14 or (B, E) day 13 and macrometastases counted. Individual mice are shown by each symbol and the results are plotted as mean ± SEM. Statistically significant differences as indicated were determined by one-way ANOVA with the Tukey post-test (for multiple comparisons) (*p < 0.5; **p < 0.01; ***p < 0.001; ****p < 0.0001).
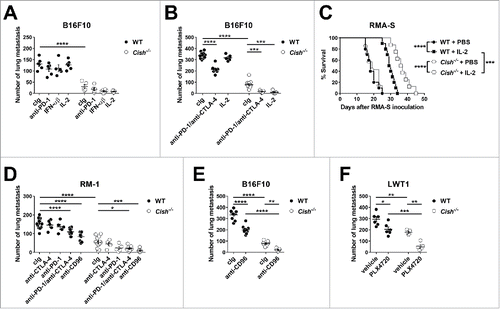
Figure 8. Combining Cish deficiency and checkpoint inhibitors or cytokine stimulation shows an improved anti-metastatic effect. (A) Groups of 5–6 B6.WT (Cish+/+) or B6.Cish−/− mice were injected i.v. with 2 × 10⁵ B16F10 melanoma cells and treated with either control Ig (cIg) (250 μg i.p. on days 0, 3, and 6), anti-PD-1 (250 μg i.p. on days 0, 3, and 6), mouse IFN-αβ (25 μg i.p. on days 0, 1, 2, and 3) or recombinant IL-2 (10,000 IU i.p. on days 0, 1, 2, and 3). (B) Groups of 5–11 B6.WT (Cish+/+) or B6.Cish−/− mice were injected i.v. with 7.5 × 10⁵ B16F10 melanoma cells and treated with either cIg (250 μg i.p. on days 0, 3, and 6), anti-PD1/anti-CTLA-4 combination (250 μg i.p. each on days 0, 3, and 6), or recombinant IL-2 (10,000 IU i.p. on days 0, 1, 2, 3, and 4). (C) Groups of 7–10 B6.WT (Cish+/+) and B6.Cish−/− mice were injected i.p. with 1 × 10⁵ parental RMA-S cells and treated with either PBS or recombinant IL-2 (100,000 IU i.p. on days 0, 1, 2, 3, and 4). Mice were monitored for tumor development and were euthanized at the point of abdominal swelling and discomfort. Improved survival between groups was assessed by the Log-rank Mantel–Cox test. (D) Groups of 5–15 B6.WT (Cish+/+) or B6.Cish−/− mice were injected i.v. with 5×10⁵ RM-1 prostate carcinoma cells and treated with either cIg, anti-CD96, anti-PD-1, anti-CTLA-4, or anti-PD1/anti-CTLA-4 combination (250 μg i.p. each on days 0 and 3). (E) Groups of 8–10 B6.WT (Cish+/+) or B6.Cish−/− mice were injected i.v. with 7.5×10⁵ B16F10 melanoma cells and treated with either 250 μg cIg or anti-CD96 mAb (i.p. on days 0 and 3). (F) Groups of 5–6 B6.WT (Cish+/+) or B6.Cish−/− mice were injected i.v. with 7.5 × 10⁵ LWT1 melanoma cells and treated with either vehicle or PLX4720 (10 mg/kg i.p., daily from days 0 to 6). Lungs were harvested on (A, D, F) day 14 or (B, E) day 13 and macrometastases counted. Individual mice are shown by each symbol and the results are plotted as mean ± SEM. Statistically significant differences as indicated were determined by one-way ANOVA with the Tukey post-test (for multiple comparisons) (*p < 0.5; **p < 0.01; ***p < 0.001; ****p < 0.0001).
Supplemental material

Supplementary_materials.zip

Download Zip (385.9 KB)

Reprints and Corporate Permissions

Please note: Selecting permissions does not provide access to the full text of the article, please see our help page How do I view content?

To request a reprint or corporate permissions for this article, please click on the relevant link below:

Academic Permissions

Please note: Selecting permissions does not provide access to the full text of the article, please see our help page How do I view content?

Obtain permissions instantly via Rightslink by clicking on the button below:

If you are unable to obtain permissions via Rightslink, please complete and submit this Permissions form. For more information, please visit our Permissions help page.