2,312
Views
24
CrossRef citations to date
0
Altmetric
Original Research

Suppression of indoleamine-2,3-dioxygenase 1 expression by promoter hypermethylation in ER-positive breast cancer

, , , , , , , , , , , , , , , , , , , , & show all
Article: e1274477 | Received 03 Oct 2016, Accepted 15 Dec 2016, Published online: 07 Feb 2017

Figures & data

Figure 1. Serum Kyn and tumoral IDO1 expression are lower in ER-positive than ER-negative breast cancer patients. (A) Sera obtained before initial surgery showed significantly lower Kyn concentrations in untreated ER-positive (n = 30) compared with untreated ER-negative breast cancer patients (n = 16, Student's t-test **p < 0.01). (B) In line, IDO1 mRNA normalized to GAPDH (Student's t-test *p < 0.05) and (C) IDO1 protein expression were higher in ER-negative (n = 6) than ER-positive (n = 9) frozen breast cancer samples from distinct patients. (D) TCGA data of breast invasive carcinoma confirm decreased IDO1 expression in ER-positive compared with ER-negative breast cancer tissue (ER(+) n = 343, ER(−) n = 99, Mann–Whitney U test ***p < 0.001). (E) Reduced IDO1 mRNA expression is observed in the ER-positive luminal compared with the mainly ER-negative Her-2 enriched and basal-like intrinsic breast cancer subtypes based on PAM50 classification, (basal-like n = 141, Her2-enriched n = 67, luminal A n = 423, luminal B n = 192). (F) In accordance with a decrease in IDO1 expression a model of Trp metabolism based on TCGA expression data of breast invasive carcinoma predicted lower Kyn concentrations in human ER-positive compared with ER-negative breast cancer (ER(+) n = 311, ER(−) n = 103, ***p < 0.001). Box plots represent the medians and the 75% and 25% percentiles. Whiskers extend to min and max values.
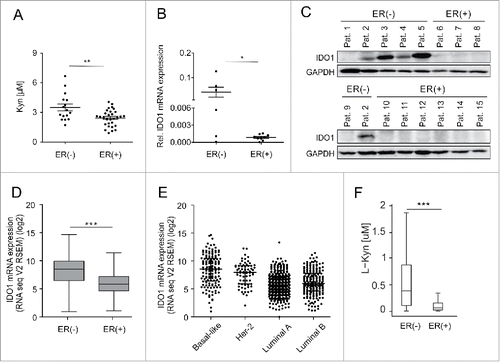
Figure 1. Serum Kyn and tumoral IDO1 expression are lower in ER-positive than ER-negative breast cancer patients. (A) Sera obtained before initial surgery showed significantly lower Kyn concentrations in untreated ER-positive (n = 30) compared with untreated ER-negative breast cancer patients (n = 16, Student's t-test **p < 0.01). (B) In line, IDO1 mRNA normalized to GAPDH (Student's t-test *p < 0.05) and (C) IDO1 protein expression were higher in ER-negative (n = 6) than ER-positive (n = 9) frozen breast cancer samples from distinct patients. (D) TCGA data of breast invasive carcinoma confirm decreased IDO1 expression in ER-positive compared with ER-negative breast cancer tissue (ER(+) n = 343, ER(−) n = 99, Mann–Whitney U test ***p < 0.001). (E) Reduced IDO1 mRNA expression is observed in the ER-positive luminal compared with the mainly ER-negative Her-2 enriched and basal-like intrinsic breast cancer subtypes based on PAM50 classification, (basal-like n = 141, Her2-enriched n = 67, luminal A n = 423, luminal B n = 192). (F) In accordance with a decrease in IDO1 expression a model of Trp metabolism based on TCGA expression data of breast invasive carcinoma predicted lower Kyn concentrations in human ER-positive compared with ER-negative breast cancer (ER(+) n = 311, ER(−) n = 103, ***p < 0.001). Box plots represent the medians and the 75% and 25% percentiles. Whiskers extend to min and max values.

Figure 2. The IDO1 promoter is hypermethylated in ER-positive breast cancer. (A) Schematic representation of regulatory elements in the human IDO1 promoter. In an upstream region of active chromatin (ENCODE ChromHMM E027 and E028, enrichment of H3K27Ac, DNase hypersensitivity cluster) an interferon sensitive response element (ISRE) and a STAT1 binding site overlap with several CpG sites as can be seen in the WGBS data. One of these CpG sites— cg10262052—is covered by 450k arrays (GRCh 37/hg19 assembly). The localization of our IDO1 luciferase reporter gene construct is depicted in green. (B) The DNA methylation level of cg10262052 is significantly lower in ER-negative (n = 99) compared with ER-positive (n = 343) breast cancers (TCGA breast invasive carcinoma, Mann–Whitney U test, ***p < 0.001). Box plots represent the medians and the 75% and 25% percentiles. Whiskers extend to min and max values. (C) DNA methylation of cg10262052 is highest in the ER-positive luminal A, luminal B breast cancer subtypes and lowest in the ER-negative basal-like subtype (basal-like n = 83, Her2-enriched n = 31, luminal A n = 272, luminal B n = 125). (D) The DNA methylation at cg10262052 negatively correlates with IDO1 mRNA expression derived from TCGA breast invasive carcinoma 450k and RNASeq data (n = 511, Spearman's rank correlation). (E) Significant hypermethylation of cg10262052 in ER-positive (n = 9) as compared with ER-negative (n = 6) breast cancer tissue was observed by pyrosequencing (Student's t-test, *p < 0.05). (F) Methylation at this CpG site negatively correlates with IDO1 mRNA expression in these samples (Spearman's rank correlation).
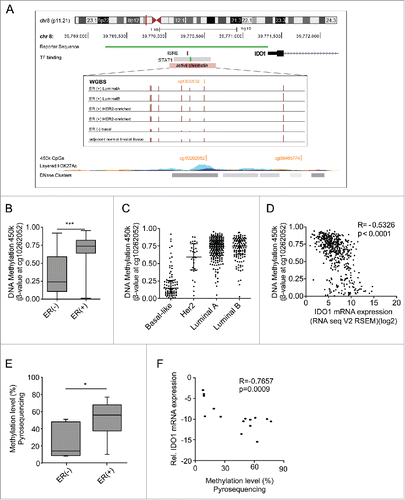
Figure 2. The IDO1 promoter is hypermethylated in ER-positive breast cancer. (A) Schematic representation of regulatory elements in the human IDO1 promoter. In an upstream region of active chromatin (ENCODE ChromHMM E027 and E028, enrichment of H3K27Ac, DNase hypersensitivity cluster) an interferon sensitive response element (ISRE) and a STAT1 binding site overlap with several CpG sites as can be seen in the WGBS data. One of these CpG sites— cg10262052—is covered by 450k arrays (GRCh 37/hg19 assembly). The localization of our IDO1 luciferase reporter gene construct is depicted in green. (B) The DNA methylation level of cg10262052 is significantly lower in ER-negative (n = 99) compared with ER-positive (n = 343) breast cancers (TCGA breast invasive carcinoma, Mann–Whitney U test, ***p < 0.001). Box plots represent the medians and the 75% and 25% percentiles. Whiskers extend to min and max values. (C) DNA methylation of cg10262052 is highest in the ER-positive luminal A, luminal B breast cancer subtypes and lowest in the ER-negative basal-like subtype (basal-like n = 83, Her2-enriched n = 31, luminal A n = 272, luminal B n = 125). (D) The DNA methylation at cg10262052 negatively correlates with IDO1 mRNA expression derived from TCGA breast invasive carcinoma 450k and RNASeq data (n = 511, Spearman's rank correlation). (E) Significant hypermethylation of cg10262052 in ER-positive (n = 9) as compared with ER-negative (n = 6) breast cancer tissue was observed by pyrosequencing (Student's t-test, *p < 0.05). (F) Methylation at this CpG site negatively correlates with IDO1 mRNA expression in these samples (Spearman's rank correlation).

Figure 3. IDO1 expression and Trp metabolism in breast cancer cells. (A) Spearman's rank correlation of gene expression with IDO1 mRNA in TCGA breast invasive carcinoma RNASeq data. IFNG, STAT1 and IRF1, which are components of IFNγ signaling, as well as CD2, CD3D and LCK, which are T-cell markers were among the top IDO1 correlated genes. Their correlation with IDO1 is depicted as scatter plots. Spearman's rank correlation coefficients and corresponding p-values are shown. (B and C) IDO1 mRNA expression normalized to 18S RNA in ER-negative (HCC1954, MDA-MB-468, MDA-MB-231) and ER-positive (MCF7, BT-474 ZR-7–51) breast cancer cell lines, in the absence (B) and presence (C) of IFNγ stimulation (1000 U/mL for 24 h), measured by qRT-PCR. (D) Representative western blots demonstrating that also on the protein level IDO1 is expressed more strongly in ER-negative than ER-positive breast cancer cells. (E) Higher Kyn production was measured by high performance liquid chromatography (HPLC) in the supernatants of ER-negative in comparison to ER-positive cells 48 h after IFNγ stimulation (n = 3). Results are expressed as mean, error bars indicate s.e.m.
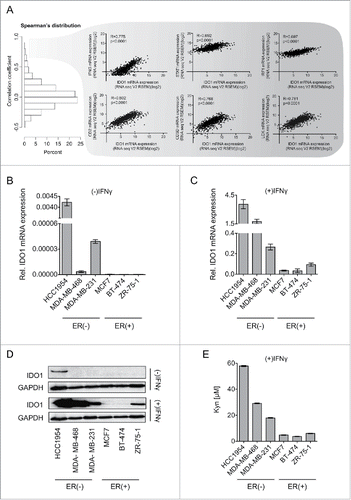
Figure 3. IDO1 expression and Trp metabolism in breast cancer cells. (A) Spearman's rank correlation of gene expression with IDO1 mRNA in TCGA breast invasive carcinoma RNASeq data. IFNG, STAT1 and IRF1, which are components of IFNγ signaling, as well as CD2, CD3D and LCK, which are T-cell markers were among the top IDO1 correlated genes. Their correlation with IDO1 is depicted as scatter plots. Spearman's rank correlation coefficients and corresponding p-values are shown. (B and C) IDO1 mRNA expression normalized to 18S RNA in ER-negative (HCC1954, MDA-MB-468, MDA-MB-231) and ER-positive (MCF7, BT-474 ZR-7–51) breast cancer cell lines, in the absence (B) and presence (C) of IFNγ stimulation (1000 U/mL for 24 h), measured by qRT-PCR. (D) Representative western blots demonstrating that also on the protein level IDO1 is expressed more strongly in ER-negative than ER-positive breast cancer cells. (E) Higher Kyn production was measured by high performance liquid chromatography (HPLC) in the supernatants of ER-negative in comparison to ER-positive cells 48 h after IFNγ stimulation (n = 3). Results are expressed as mean, error bars indicate s.e.m.

Figure 4. IDO1 expression and activity is suppressed by IDO1 promoter hypermethylation in ER-positive breast cancer cells. Treatment of ER-positive breast cancer cells with the demethylating agent 5-Aza (10 μM, 5 d) followed by stimulation with IFNγ (1000 U/mL, 48 h) significantly increased (A) IDO1 mRNA expression relative to GAPDH and (B) IDO1 protein expression (n = 3, per group). (C) Similarly, Kyn production of cells treated with 5-Aza for 5 d and subsequent IFNγ-stimulation for 48 h (n = 3) measured by HPLC was significantly increased compared with non-5-Aza treated controls (n = 3). 5-Aza treatment of the ER-negative HCC1954 cells neither influenced (D) IDO1 mRNA expression nor (E) IDO1 protein expression. (F) Activity of the unmethylated and the methylated IDO1 promoter was measured by luciferase reporter assay after stimulation with IFNγ (8 h; 20 U/mL for ZR-75–1 and HCC1954, 100 U/mL for BT-474 and MDA-MB-231), indicating that DNA methylation reduces IDO1 expression. Results are expressed as means, error bars indicate s.e.m. Statistical significance was determined by Student's t-tests, *p < 0.05, **p < 0.01, ***p < 0.001.
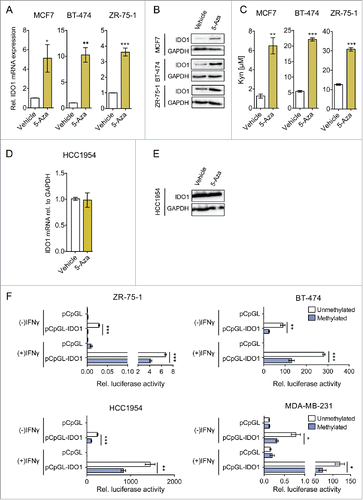
Figure 4. IDO1 expression and activity is suppressed by IDO1 promoter hypermethylation in ER-positive breast cancer cells. Treatment of ER-positive breast cancer cells with the demethylating agent 5-Aza (10 μM, 5 d) followed by stimulation with IFNγ (1000 U/mL, 48 h) significantly increased (A) IDO1 mRNA expression relative to GAPDH and (B) IDO1 protein expression (n = 3, per group). (C) Similarly, Kyn production of cells treated with 5-Aza for 5 d and subsequent IFNγ-stimulation for 48 h (n = 3) measured by HPLC was significantly increased compared with non-5-Aza treated controls (n = 3). 5-Aza treatment of the ER-negative HCC1954 cells neither influenced (D) IDO1 mRNA expression nor (E) IDO1 protein expression. (F) Activity of the unmethylated and the methylated IDO1 promoter was measured by luciferase reporter assay after stimulation with IFNγ (8 h; 20 U/mL for ZR-75–1 and HCC1954, 100 U/mL for BT-474 and MDA-MB-231), indicating that DNA methylation reduces IDO1 expression. Results are expressed as means, error bars indicate s.e.m. Statistical significance was determined by Student's t-tests, *p < 0.05, **p < 0.01, ***p < 0.001.

Figure 5. High ESR1 expression is not associated with IDO1 promoter methylation and reduced IDO1 expression in cervical and endometrial carcinoma. (A) IDO1 mRNA expression is higher in ESR1 high (n = 152, higher than the median ESR1 expression) than ESR1 low (n = 153, equal or lower than the median ESR1 expression) cervical cancers (TCGA, cervical squamous cell carcinoma and endocervical adenocarcinoma; Student's t-test, **p < 0.01). (B) The DNA methylation at cg10262052 inversely correlates with IDO1 mRNA expression derived from TCGA (n = 305, Spearman's rank correlation). (C) The DNA methylation level of cg10262052 does not differ between ESR1 low (n = 153) compared with ESR1 high (n = 152) cervical cancers (TCGA, cervical squamous cell carcinoma and endocervical adenocarcinoma, Mann–Whitney U test). (D) IDO1 mRNA expression does not differ between ESR1 low (n = 87, equal and lower than the median ESR1 expression) compared with ESR1 high (n = 86, higher than the median ESR1 expression) human endometrial carcinoma tissues derived from TCGA uterine corpus endometrial carcinoma RNASeq data; Student's t-test. (E) The DNA methylation at cg10262052 does not correlate with IDO1 mRNA expression derived from TCGA uterine corpus endometrial carcinoma (n = 173, Spearman's rank correlation). (F) The DNA methylation level of cg10262052 is lower in ESR1 high (n = 86) compared with ESR1 low (n = 87) endometrial carcinomas (TCGA, uterine corpus endometrial carcinoma, Mann–Whitney U test). Box plots represent the medians and the 75% and 25% percentiles. Whiskers extend to min and max values.
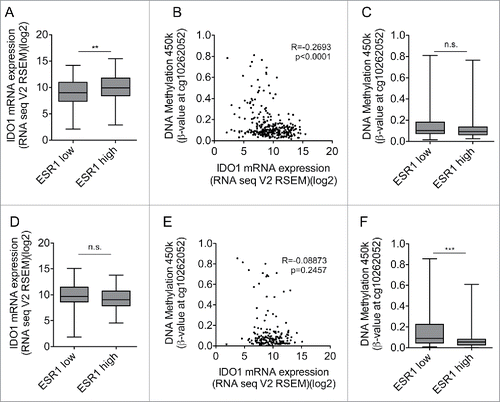
Figure 5. High ESR1 expression is not associated with IDO1 promoter methylation and reduced IDO1 expression in cervical and endometrial carcinoma. (A) IDO1 mRNA expression is higher in ESR1 high (n = 152, higher than the median ESR1 expression) than ESR1 low (n = 153, equal or lower than the median ESR1 expression) cervical cancers (TCGA, cervical squamous cell carcinoma and endocervical adenocarcinoma; Student's t-test, **p < 0.01). (B) The DNA methylation at cg10262052 inversely correlates with IDO1 mRNA expression derived from TCGA (n = 305, Spearman's rank correlation). (C) The DNA methylation level of cg10262052 does not differ between ESR1 low (n = 153) compared with ESR1 high (n = 152) cervical cancers (TCGA, cervical squamous cell carcinoma and endocervical adenocarcinoma, Mann–Whitney U test). (D) IDO1 mRNA expression does not differ between ESR1 low (n = 87, equal and lower than the median ESR1 expression) compared with ESR1 high (n = 86, higher than the median ESR1 expression) human endometrial carcinoma tissues derived from TCGA uterine corpus endometrial carcinoma RNASeq data; Student's t-test. (E) The DNA methylation at cg10262052 does not correlate with IDO1 mRNA expression derived from TCGA uterine corpus endometrial carcinoma (n = 173, Spearman's rank correlation). (F) The DNA methylation level of cg10262052 is lower in ESR1 high (n = 86) compared with ESR1 low (n = 87) endometrial carcinomas (TCGA, uterine corpus endometrial carcinoma, Mann–Whitney U test). Box plots represent the medians and the 75% and 25% percentiles. Whiskers extend to min and max values.

Figure 6. Overview of the modulation of IDO1 by ER in breast cancer. In ER-positive breast cancer, hypermethylation (HyperM) of CpGs in the IDO1 promoter reduces IDO1 expression. Reduced IDO1 expression results in less production of immunosuppressive kynurenine. In contrast, in ER-negative breast cancer the CpGs in the IDO1 promoter are hypomethylated (HypoM) leading to stronger induction of IDO1, increased production of Kyn and finally enhanced suppression of antitumor immune responses.
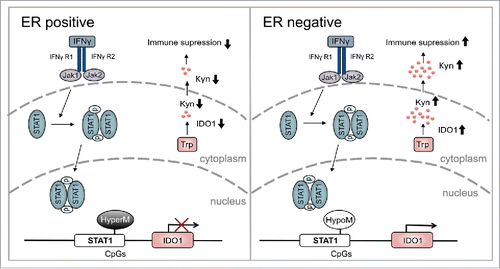
Figure 6. Overview of the modulation of IDO1 by ER in breast cancer. In ER-positive breast cancer, hypermethylation (HyperM) of CpGs in the IDO1 promoter reduces IDO1 expression. Reduced IDO1 expression results in less production of immunosuppressive kynurenine. In contrast, in ER-negative breast cancer the CpGs in the IDO1 promoter are hypomethylated (HypoM) leading to stronger induction of IDO1, increased production of Kyn and finally enhanced suppression of antitumor immune responses.
Supplemental material

KONI_A_1274477_supplementary_data.zip

Download Zip (758.6 KB)

Reprints and Corporate Permissions

Please note: Selecting permissions does not provide access to the full text of the article, please see our help page How do I view content?

To request a reprint or corporate permissions for this article, please click on the relevant link below:

Academic Permissions

Please note: Selecting permissions does not provide access to the full text of the article, please see our help page How do I view content?

Obtain permissions instantly via Rightslink by clicking on the button below:

If you are unable to obtain permissions via Rightslink, please complete and submit this Permissions form. For more information, please visit our Permissions help page.