2,768
Views
90
CrossRef citations to date
0
Altmetric
Original Research

Genotoxic stress modulates the release of exosomes from multiple myeloma cells capable of activating NK cell cytokine production: Role of HSP70/TLR2/NF-kB axis

, , , ORCID Icon, , , , , , , , , , ORCID Icon, , , & show all
Article: e1279372 | Received 16 Aug 2016, Accepted 02 Jan 2017, Published online: 01 Mar 2017

Figures & data

Figure 1. Melphalan-treated MM cells release a higher amount of exosomes. (A) MM cells were cultured for 48 h in the presence or not of MEL, and then exosomes were isolated from the conditioned media. Size distribution of SKO-007(J3)- and ARK-derived exosomes was analyzed through DLS. A representative experiment out of three is shown. (B) The number of exosomes/cell was calculated through the DLS (details can be found in Fig. S1). In parallel, the amount of total proteins recovered from exosomal preparations derived from 106 cells was evaluated by BPA. The mean values of three (for SKO-007(J3)) or four (for ARK) independent experiments ± SEM is shown. (C) Data are expressed as fold increase of the number of particles/cell obtained from MEL-treated MM cells divided by the number of particles/cell of the untreated group. The mean of three (for SKO-007(J3)) or four (for ARK) independent experiments ± SEM is shown. (D) Data are expressed as fold increase of the μg of exosomal proteins/106 cells values obtained from MEL treated MM cells divided by μg/106 cells of the untreated group. The mean of nine (for SKO-007(J3)) or six (for ARK) independent experiments ± SEM is shown.
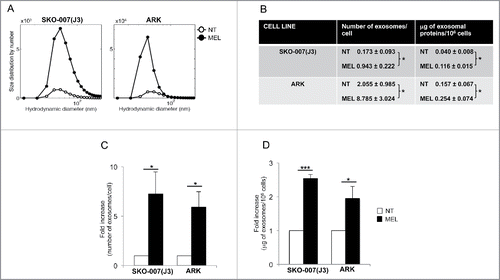
Figure 1. Melphalan-treated MM cells release a higher amount of exosomes. (A) MM cells were cultured for 48 h in the presence or not of MEL, and then exosomes were isolated from the conditioned media. Size distribution of SKO-007(J3)- and ARK-derived exosomes was analyzed through DLS. A representative experiment out of three is shown. (B) The number of exosomes/cell was calculated through the DLS (details can be found in Fig. S1). In parallel, the amount of total proteins recovered from exosomal preparations derived from 106 cells was evaluated by BPA. The mean values of three (for SKO-007(J3)) or four (for ARK) independent experiments ± SEM is shown. (C) Data are expressed as fold increase of the number of particles/cell obtained from MEL-treated MM cells divided by the number of particles/cell of the untreated group. The mean of three (for SKO-007(J3)) or four (for ARK) independent experiments ± SEM is shown. (D) Data are expressed as fold increase of the μg of exosomal proteins/106 cells values obtained from MEL treated MM cells divided by μg/106 cells of the untreated group. The mean of nine (for SKO-007(J3)) or six (for ARK) independent experiments ± SEM is shown.

Figure 2. Characterization of MM cell-derived exosomes. (A) Electron microscope analysis of exosomes morphology and size. A representative picture of SKO-007(J3)-derived exosomes is shown. (B) Immune-gold labeling for Tsg101 and CD81 of SKO-007(J3)-derived exosomes. (C) Western blot analysis was performed on lysates derived from exosome fractions or from cell pellet, using anti-Hsp70, anti-MHC I, anti-Tsg101, anti-CD63 and anti-calreticulin antibodies. (D) Visualization of CD63-conjugated beads coated with exosomes by immunofluorescence and FACS analysis (upper panel). CD63 expression on the surface of exosomes was assessed after overnight incubation of exosomes with beads, exosomes were stained with anti-CD63 mAb (thin histograms) or control isotypic Ig (filled histograms) (bottom panel).
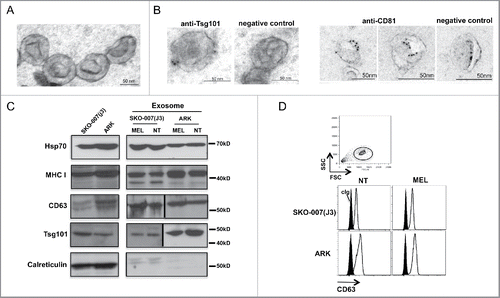
Figure 2. Characterization of MM cell-derived exosomes. (A) Electron microscope analysis of exosomes morphology and size. A representative picture of SKO-007(J3)-derived exosomes is shown. (B) Immune-gold labeling for Tsg101 and CD81 of SKO-007(J3)-derived exosomes. (C) Western blot analysis was performed on lysates derived from exosome fractions or from cell pellet, using anti-Hsp70, anti-MHC I, anti-Tsg101, anti-CD63 and anti-calreticulin antibodies. (D) Visualization of CD63-conjugated beads coated with exosomes by immunofluorescence and FACS analysis (upper panel). CD63 expression on the surface of exosomes was assessed after overnight incubation of exosomes with beads, exosomes were stained with anti-CD63 mAb (thin histograms) or control isotypic Ig (filled histograms) (bottom panel).

Figure 3. MM cell-derived exosomes are uptaken by primary NK cells and induce CD69 expression. (A) SKO-007(J3)-derived exosomes were labeled with the red fluorescent dye PKH26. Primary peripheral blood human NK cells were incubated for different times with 20 μg/mL of PKH26-labeled exosomes with or without IL-15 (50 ng/mL). The fluorescence of internalized exosomes was evaluated by immunofluorescence and FACS analysis and measured as the percentage of PKH26+ cells. One representative experiment is shown. (B) NK cells were cultured for 3 h in the presence of PKH26-labeled exosomes and IL-15 as described in panel (A), or with a combination of PKH26-labeled exosomes and trypsin, or PKH26-labeled and unlabeled exosomes at 1:3 ratio. The mean of three independent experiments ± SEM is shown. (C) NK cells were incubated for 3 h with PKH26-labeled exosomes (20 µg/mL), washed and plated on poly-L-lysine-coated multichamber glass plates and fixed. Images were acquired using an ApoTome Observer Z.1 microscope with a 60x/1.4 NA Plan-Neofluar oil immersion objective. Upper panels: Representative images of single cells are shown as maximum intensity projection (3 Z sections with 0.2 μm spacing). Lower panels: Differential interference contrast overlay the fluorescence images were also shown. Bar represents 5 µm. (D) NK cells were incubated for 3 h with PKH26-labeled exosomes (20 µg/mL), anti-CD56APC was added the last 20 min. Cells were washed and the fluorescence of internalized exosomes was evaluated by immunofluorescence and FACS analysis and measured as the percentage of PKH26+ cells by gating on CD56low and CD56high subsets. The mean of four experiments is shown. (E) NK cells were pre-treated for 1 h with EDTA (2 mM), EIPA (50 μM), dynasore (50 μM), nystatin (40 μg/mL) and then incubated for 3 h with PKH26-labeled exosomes (20 µg/mL), the fluorescence of internalized exosomes was evaluated by immunofluorescence and FACS analysis and measured as the percentage of PKH26+ cells. Data expressed as the percentage of uptake were referred to the untreated cells considered as 100%. Values reported represent the mean of three independent experiments ± SEM. (F) NK cells were incubated for 48 h with different amounts of SKO-007(J3)-derived exosomes as indicated. CD69 expression was evaluated by immunofluorescence and FACS analysis. Numbers in each histogram represent the percentage of CD69+ cells. A representative experiment is shown. (G) NK cells were incubated with 20 μg/mL of SKO-007(J3) and ARK–derived exosomes as described in panel (F). Where indicated, exosomes were prepared from MEL-treated MM cells (exo MEL). Data are represented as the mean values of the percentage of CD69+ NK cells of four (for SKO-007(J3)-derived exosomes) or five (for ARK-derived exosomes) independent experiments ± SEM.
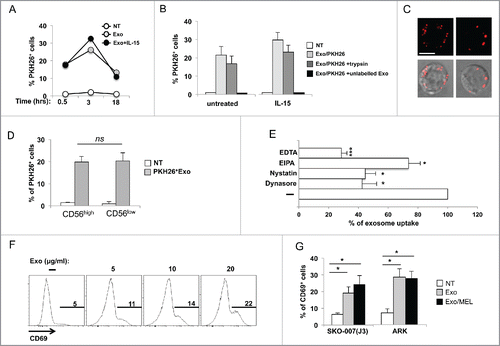
Figure 3. MM cell-derived exosomes are uptaken by primary NK cells and induce CD69 expression. (A) SKO-007(J3)-derived exosomes were labeled with the red fluorescent dye PKH26. Primary peripheral blood human NK cells were incubated for different times with 20 μg/mL of PKH26-labeled exosomes with or without IL-15 (50 ng/mL). The fluorescence of internalized exosomes was evaluated by immunofluorescence and FACS analysis and measured as the percentage of PKH26+ cells. One representative experiment is shown. (B) NK cells were cultured for 3 h in the presence of PKH26-labeled exosomes and IL-15 as described in panel (A), or with a combination of PKH26-labeled exosomes and trypsin, or PKH26-labeled and unlabeled exosomes at 1:3 ratio. The mean of three independent experiments ± SEM is shown. (C) NK cells were incubated for 3 h with PKH26-labeled exosomes (20 µg/mL), washed and plated on poly-L-lysine-coated multichamber glass plates and fixed. Images were acquired using an ApoTome Observer Z.1 microscope with a 60x/1.4 NA Plan-Neofluar oil immersion objective. Upper panels: Representative images of single cells are shown as maximum intensity projection (3 Z sections with 0.2 μm spacing). Lower panels: Differential interference contrast overlay the fluorescence images were also shown. Bar represents 5 µm. (D) NK cells were incubated for 3 h with PKH26-labeled exosomes (20 µg/mL), anti-CD56APC was added the last 20 min. Cells were washed and the fluorescence of internalized exosomes was evaluated by immunofluorescence and FACS analysis and measured as the percentage of PKH26+ cells by gating on CD56low and CD56high subsets. The mean of four experiments is shown. (E) NK cells were pre-treated for 1 h with EDTA (2 mM), EIPA (50 μM), dynasore (50 μM), nystatin (40 μg/mL) and then incubated for 3 h with PKH26-labeled exosomes (20 µg/mL), the fluorescence of internalized exosomes was evaluated by immunofluorescence and FACS analysis and measured as the percentage of PKH26+ cells. Data expressed as the percentage of uptake were referred to the untreated cells considered as 100%. Values reported represent the mean of three independent experiments ± SEM. (F) NK cells were incubated for 48 h with different amounts of SKO-007(J3)-derived exosomes as indicated. CD69 expression was evaluated by immunofluorescence and FACS analysis. Numbers in each histogram represent the percentage of CD69+ cells. A representative experiment is shown. (G) NK cells were incubated with 20 μg/mL of SKO-007(J3) and ARK–derived exosomes as described in panel (F). Where indicated, exosomes were prepared from MEL-treated MM cells (exo MEL). Data are represented as the mean values of the percentage of CD69+ NK cells of four (for SKO-007(J3)-derived exosomes) or five (for ARK-derived exosomes) independent experiments ± SEM.

Figure 4. MM cell-derived exosomes do not affect NK cell degranulation and cytotoxicity but enhance cytokine and chemokine production. (A) NK cells were incubated for 48 h with 20 μg/mL of SKO-007(J3)-derived exosomes. The degranulation assay was performed against the sensitive target K562, using the CD107a lysosomal marker. The percentage of CD107+ NK cells is indicated in each panel. Two representative donors are shown. (B) The mean values of five independent experiments are shown. (C) NK cells were incubated in the presence of exosomes as in panel (A). The cytotoxic activity of untreated or exosome-treated NK cells was assayed against K562 target cells. Two representative experiments are shown. (D) The mean values of three independent experiments at the indicated E:T ratio are shown. (E) NK cells were incubated in the presence of exosomes as in panel (A). Cells were harvested and supernatants were collected and the amount of different cytokines as indicated, was measured by performing a Luminex assay. The mean values of three independent experiments ± SEM are shown. Medium containing exosome alone has undetectable levels of cytokine/chemokines (data not shown).
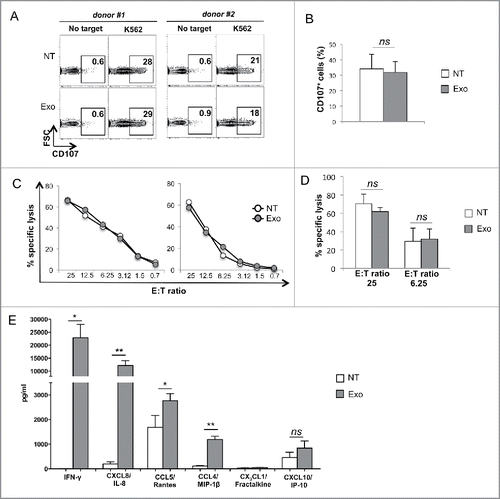
Figure 4. MM cell-derived exosomes do not affect NK cell degranulation and cytotoxicity but enhance cytokine and chemokine production. (A) NK cells were incubated for 48 h with 20 μg/mL of SKO-007(J3)-derived exosomes. The degranulation assay was performed against the sensitive target K562, using the CD107a lysosomal marker. The percentage of CD107+ NK cells is indicated in each panel. Two representative donors are shown. (B) The mean values of five independent experiments are shown. (C) NK cells were incubated in the presence of exosomes as in panel (A). The cytotoxic activity of untreated or exosome-treated NK cells was assayed against K562 target cells. Two representative experiments are shown. (D) The mean values of three independent experiments at the indicated E:T ratio are shown. (E) NK cells were incubated in the presence of exosomes as in panel (A). Cells were harvested and supernatants were collected and the amount of different cytokines as indicated, was measured by performing a Luminex assay. The mean values of three independent experiments ± SEM are shown. Medium containing exosome alone has undetectable levels of cytokine/chemokines (data not shown).

Figure 5. MM cell-derived exosomes stimulate IFNγ production through a mechanism mediated by NF-kB pathway. (A) NK cells were incubated for 48 h with 20 μg/mL of SKO-007(J3)-derived exosomes. Real-time PCR analysis of IFNγ mRNA. Data, expressed as fold change units, were normalized with β-actin and referred to the untreated cells considered as calibrator. Values reported represent the mean of six independent experiments ± SEM. (B) NK cells were incubated with 20 μg/mL of SKO-007(J3)-derived exosomes as described in A. Western blot analysis was performed on total cell lysates using p65, phospho-p65 (p-p65) and β-actin Abs. Numbers beneath each line represent quantification of p-p65 and p65 by densitometry normalized with β-actin. (C) NK cells were pretreated for 1 h with the NF-kB inhibitor, SN50 (15 µM), and then incubated with 20 μg/mL of SKO-007(J3)-derived exosomes for 48 h. Real-time PCR analysis of IFNγ mRNA was performed as described in panel (A). The mean of three independent experiments is shown. (D) Nuclear extracts were prepared from NK cells untreated or treated with MM-derived exosomes, and analyzed by EMSA. The nuclear extract derived from NK cells treated with MM exosomes was used for competition with unlabelled probes as indicated in the right panel. (E) NK cells were cultured with 20 μg/mL of SKO-007(J3) cells-derived exosomes in the presence of IL-15 (50 ng/mL). After 24 h, BFA (5 µg/mL) was added and left for additional 24 h. Intracellular IFNγ expression was evaluated by immunofluorescence and FACS analysis. Numbers represent the percentage of IFNγ+ NK cells. One representative experiment is shown. (F) Data were represented as mean values of the percentage of IFNγ+ cells of seven independent experiments ± SEM.
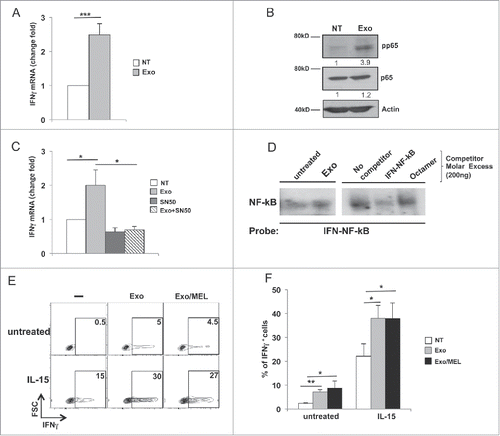
Figure 5. MM cell-derived exosomes stimulate IFNγ production through a mechanism mediated by NF-kB pathway. (A) NK cells were incubated for 48 h with 20 μg/mL of SKO-007(J3)-derived exosomes. Real-time PCR analysis of IFNγ mRNA. Data, expressed as fold change units, were normalized with β-actin and referred to the untreated cells considered as calibrator. Values reported represent the mean of six independent experiments ± SEM. (B) NK cells were incubated with 20 μg/mL of SKO-007(J3)-derived exosomes as described in A. Western blot analysis was performed on total cell lysates using p65, phospho-p65 (p-p65) and β-actin Abs. Numbers beneath each line represent quantification of p-p65 and p65 by densitometry normalized with β-actin. (C) NK cells were pretreated for 1 h with the NF-kB inhibitor, SN50 (15 µM), and then incubated with 20 μg/mL of SKO-007(J3)-derived exosomes for 48 h. Real-time PCR analysis of IFNγ mRNA was performed as described in panel (A). The mean of three independent experiments is shown. (D) Nuclear extracts were prepared from NK cells untreated or treated with MM-derived exosomes, and analyzed by EMSA. The nuclear extract derived from NK cells treated with MM exosomes was used for competition with unlabelled probes as indicated in the right panel. (E) NK cells were cultured with 20 μg/mL of SKO-007(J3) cells-derived exosomes in the presence of IL-15 (50 ng/mL). After 24 h, BFA (5 µg/mL) was added and left for additional 24 h. Intracellular IFNγ expression was evaluated by immunofluorescence and FACS analysis. Numbers represent the percentage of IFNγ+ NK cells. One representative experiment is shown. (F) Data were represented as mean values of the percentage of IFNγ+ cells of seven independent experiments ± SEM.

Figure 6. MM exosomes stimulate IFNγ production in a TLR2-dependent manner. (A) NK cells were incubated with increasing doses of Pam3CSK4 or SKO-007(J3) cell-derived exosomes, as indicated. After 24 h, BFA (5 µg/mL) was added and left for additional 24 h. Intracellular IFNγ expression was evaluated by immunofluorescence and FACS analysis. The gating strategy used consists in separating CD56high cells from CD56low NK cells. Numbers indicate the percentage of IFNγ+ cells. A representative experiment is shown. (B) NK cells were incubated with exosomes (20 µg/mL) as described in panel (A). The mean values of four independent experiments ± SEM is shown. (C) NK cells were FACs sorted based on CD56 expression levels, and incubated for 48 h with SKO-007(J3)-derived exosomes (20 µg/mL) or Pam3CSK4 (1 μM). Real-time PCR analysis of IFNγ mRNA was performed and the data, expressed as fold change units, were normalized with β-actin and referred to the untreated cells considered as calibrator. The mean values of five independent experiments ± SEM are shown. (D) Cell surface expression of TLR2 was evaluated on CD56+CD3 total NK cells, on CD56highCD3 and CD56lowCD3 NK cell subsets of total PBMC derived from 10 different healthy donors. Values represent the mean fluorescence intensity (MFI) of TLR2 substracted from the MFI value of the isotype control Ig. (E) CD56high NK cells were pretreated for 20 min with anti-TLR2 neutralizing antibody (1μg/106 cells), and then incubated with both TLR2 agonist and exosomes as described in panel (B). Real-time PCR analysis of IFNγ mRNA was performed and the data, expressed as fold change units, were normalized with β-actin and referred to the untreated cells considered as calibrator. Results relative to two representative donors are shown.
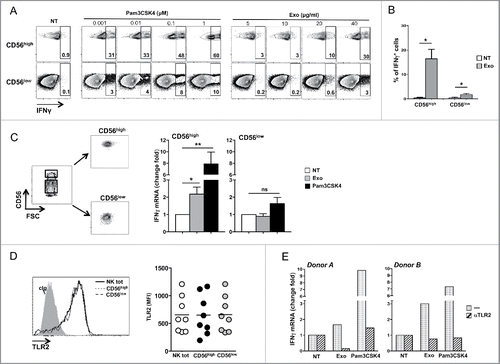
Figure 6. MM exosomes stimulate IFNγ production in a TLR2-dependent manner. (A) NK cells were incubated with increasing doses of Pam3CSK4 or SKO-007(J3) cell-derived exosomes, as indicated. After 24 h, BFA (5 µg/mL) was added and left for additional 24 h. Intracellular IFNγ expression was evaluated by immunofluorescence and FACS analysis. The gating strategy used consists in separating CD56high cells from CD56low NK cells. Numbers indicate the percentage of IFNγ+ cells. A representative experiment is shown. (B) NK cells were incubated with exosomes (20 µg/mL) as described in panel (A). The mean values of four independent experiments ± SEM is shown. (C) NK cells were FACs sorted based on CD56 expression levels, and incubated for 48 h with SKO-007(J3)-derived exosomes (20 µg/mL) or Pam3CSK4 (1 μM). Real-time PCR analysis of IFNγ mRNA was performed and the data, expressed as fold change units, were normalized with β-actin and referred to the untreated cells considered as calibrator. The mean values of five independent experiments ± SEM are shown. (D) Cell surface expression of TLR2 was evaluated on CD56+CD3− total NK cells, on CD56highCD3− and CD56lowCD3− NK cell subsets of total PBMC derived from 10 different healthy donors. Values represent the mean fluorescence intensity (MFI) of TLR2 substracted from the MFI value of the isotype control Ig. (E) CD56high NK cells were pretreated for 20 min with anti-TLR2 neutralizing antibody (1μg/106 cells), and then incubated with both TLR2 agonist and exosomes as described in panel (B). Real-time PCR analysis of IFNγ mRNA was performed and the data, expressed as fold change units, were normalized with β-actin and referred to the untreated cells considered as calibrator. Results relative to two representative donors are shown.

Figure 7. HSP70 is associated to MM cell-derived exosomes and contribute to IFNγ production. (A) HSP70 expression on the surface of exosomes was assessed after overnight incubation of exosomes with latex-beads. Exosomes derived from untreated or MEL-treated MM cells were stained with anti-HSP70 mAb or control isotypic Ig. One out of three experiments is shown. (B) Purified NK cells were incubated for 24 h with 20 µg/mL of SKO-007(J3)-derived exosomes in the presence of A8 aptamer or with a scramble peptide both used at 30 μM. Real-time PCR analysis of IFNγ mRNA was performed and the data, expressed as fold change units, were normalized with β-actin and referred to the untreated cells or scramble/treated cells considered as calibrators. The mean values of three independent experiments ± SEM are shown. (C–D) Exosomes were extracted from the plasma of PB or BM-derived from MM patients (Pt), lysed in RIPA buffer and ELISA for HSP70 or CD63 was performed. In panel (C), absolute values of both CD63 and HSP70 are shown for five patients. In panel (D), values of HSP70 were normalized with CD63 and used to compare the relative amount of BM HSP70 vs. PB HSP70. Results relative to nine patients are shown.
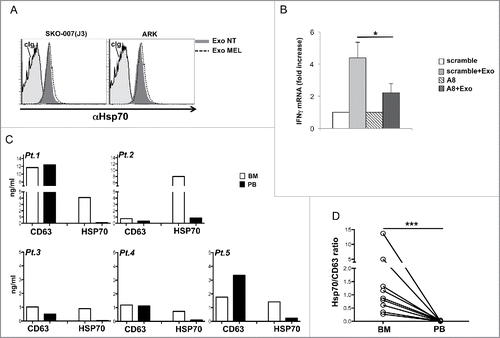
Figure 7. HSP70 is associated to MM cell-derived exosomes and contribute to IFNγ production. (A) HSP70 expression on the surface of exosomes was assessed after overnight incubation of exosomes with latex-beads. Exosomes derived from untreated or MEL-treated MM cells were stained with anti-HSP70 mAb or control isotypic Ig. One out of three experiments is shown. (B) Purified NK cells were incubated for 24 h with 20 µg/mL of SKO-007(J3)-derived exosomes in the presence of A8 aptamer or with a scramble peptide both used at 30 μM. Real-time PCR analysis of IFNγ mRNA was performed and the data, expressed as fold change units, were normalized with β-actin and referred to the untreated cells or scramble/treated cells considered as calibrators. The mean values of three independent experiments ± SEM are shown. (C–D) Exosomes were extracted from the plasma of PB or BM-derived from MM patients (Pt), lysed in RIPA buffer and ELISA for HSP70 or CD63 was performed. In panel (C), absolute values of both CD63 and HSP70 are shown for five patients. In panel (D), values of HSP70 were normalized with CD63 and used to compare the relative amount of BM HSP70 vs. PB HSP70. Results relative to nine patients are shown.
Supplemental material

KONI_A_1279372_supplementary_data.zip

Download Zip (2.5 MB)

Reprints and Corporate Permissions

Please note: Selecting permissions does not provide access to the full text of the article, please see our help page How do I view content?

To request a reprint or corporate permissions for this article, please click on the relevant link below:

Academic Permissions

Please note: Selecting permissions does not provide access to the full text of the article, please see our help page How do I view content?

Obtain permissions instantly via Rightslink by clicking on the button below:

If you are unable to obtain permissions via Rightslink, please complete and submit this Permissions form. For more information, please visit our Permissions help page.